Crypto Market Analysis – Bearish Indications
After Crypto-ML trades close, our machine learning models go through a reassessment process and give an updated perspective on the crypto market. They do this by incorporating the latest data and making adjustments to be better prepared for future market movements.
By looking at the various indicators on Crypto-ML, it appears a bigger picture may be forming. And while we desire another leg to this bull run, there are warning signs across our platform that prices may be moving lower–at least temporarily.
In this post, we’ll walk through an analysis of each of our Member Dashboard tools.
Tighter Stop Losses
One of the strongest indicators that our machine learning is predicting a challenging market is the stop losses. Our machine learning evaluates and sets stop loss recommendations based on expected future market performance.
If the stop losses become very tight, it is generally an indicator of uncertainty. In this case, as trades are opened, if there is a slight move against the trade, our signals will close and prefer to await the next opportunity.
As you can see here, the stop losses have tightened significantly:

- BTC at -1%, which is the most bearish.
- ETH and BCH are at the -2% level.
- LTC remains in more of a bullish stance, open to a bit more risk.
If you follow our principle of “swim with the current,” this change is signaling to hop out of the water at an early sign of flow the other way. If the machine learning models were “feeling” more bullish, they would instead tolerate a bit more ebb and flow.
Weakening Fear and Greed Index
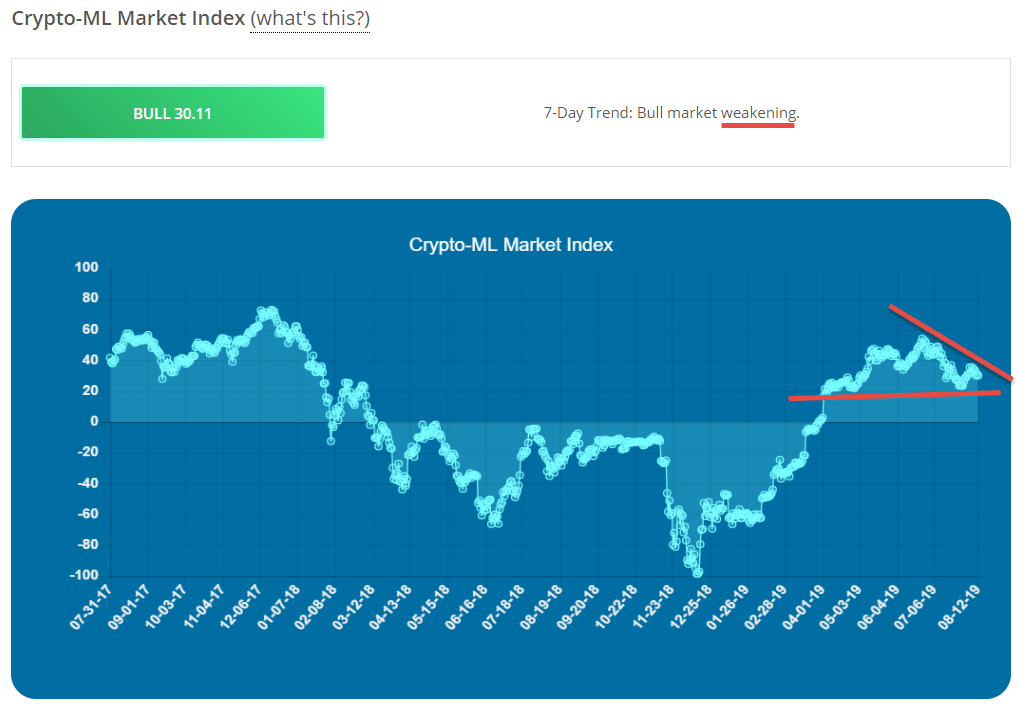
The Fear and Greed Index is tasked with predicting the general crypto market movement for the next 30 days (learn how the Fear and Greed Index works).
Interestingly, the Fear and Greed Index does seem to form trends that can be analyzed using traditional technical analysis techniques. That is, it seems to exhibit support and resistance lines and other patterns.
Looking at the Fear and Greed Index, we can clearly see it is weakening. It has been dropping since June 2.
But diving in deeper, we can also see a bearish pattern developing with lower highs being achieved.

While the lows seem to be hitting resistance, the highs are consistently dropping. That formation looks like a descending triangle, which is a bearish formation and may result in a negative breakout.
Based on this, we may be poised for further downside.
Closing Trade Alerts
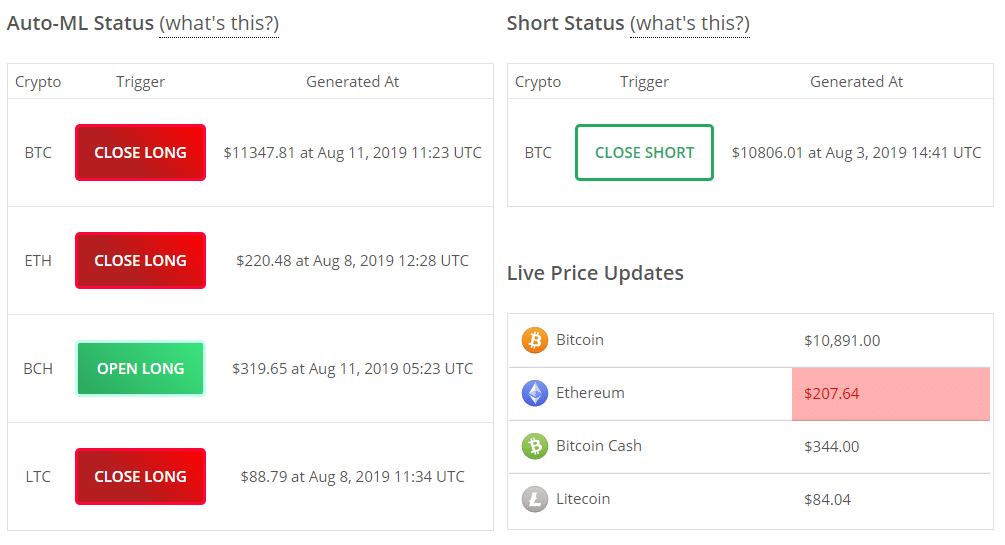
As of last week, most of our signals moved to a “close” position.
The only exception is BCH, which reopened. As you can see below, BCH price has moved up about 8% since the alert was generated; however, all others have continued to drop.

When the signals move in unison, that is generally another sign of changing market conditions.
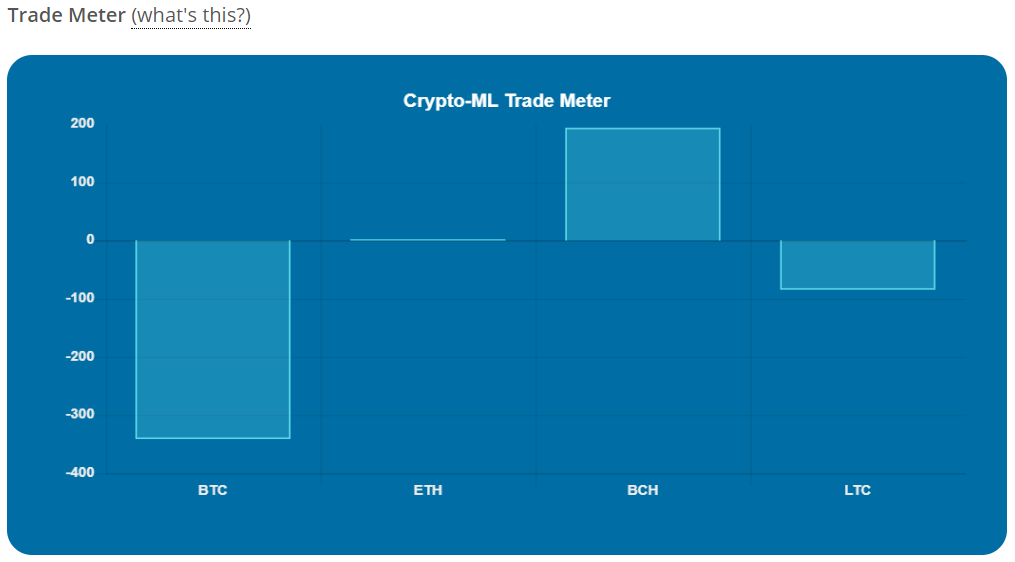
Dropping Trade Meter
Last up is the Trade Meter, which is a visualization of how strong a particular trade is relative to historical trades. By looking at the visual, it can be seen that BTC has moved to a very low number. As with the stop loss value, BTC is leading the way in bearish sentiment.

This means relative to recent trades, BTC is far from moving to a “BUY” position. The further negative it goes, the less likely it will be to turn into an open long trade.
What Does the News Say?
As expected, analysts are predictably all over the place:
- Technical Bias Favors More Downsides (Newbtc.com)
- $250,000 Bitcoin Price Call (YahooFinance.com)
- Simpsons Pattern Rears Its Ugly Head (CCN.com)
- Tether Supply Suggests Bitcoin Price is Correcting to $20,000 (CoinTelegraph.com)
This is why we created a machine learning-based system.
Recommendation
If you’re a trader:
Our collective data modeling urges caution. According to our Fear and Greed Index, we’re still in a bull market, but it appears to be waning–at least for now. The reality is, no one and no machine knows exactly what will happen next. But we like to have the data and machine modeling in our corner.
Practically, we will employ tighter stop losses and smaller trades. If we do cross into bear territory, it will be time to seek short trades.
If you’re an investor:
Investors believe in long-term price increases for crypto. Investing is very different than trading–rather than swimming with the current, you want to operate counter the market. Just like real estate investors who gobble up houses while everyone else is foreclosing, a crypto market pullback could be welcome.
This data seems to indicate we’re nearing another accumulation opportunity.
Feedback
What do you make of this data? And where do you think the markets are headed? Let us know in the comments below or on the Community Forums!
And if you’re not a customer yet, please be sure to check out our Free and Paid Memberships.
Thanks for reading.
About Crypto-ML
Whether you want to own 1, 10, or hundreds of bitcoins, we strive to help you realize your goal faster. Learn more and join for free.
Subscribe to the Newsletter
Join 7k+ working professionals to "The Five-Year Plan". Every Saturday morning, you'll receive one actionable tip to create life-changing wealth in crypto.