Insights From the Fear and Greed Index: Reversal Pending?
We have recently seen interesting behavior in the Crypto-ML Fear and Greed Index that is worth dissecting. In this post, you’ll see an analysis of the current crypto market status and implications for where we may be heading.
The Fear and Greed Index is a broad-based measure of general crypto market sentiment, designed so:
- Traders can swim with the current
- Investors can make better long-term decisions
Learn more about the Crypto-ML Fear and Greed Index.
We, of course, recommend using it with our Trade Alerts (Trader Membership), but even if you’re on our Free Plan, it can also be used as a tool for your long-term investments or to pair with your own trading methodology.
Is a Market Reversal Pending?
While we are still in a bear market, there has been interesting action on the Fear and Greed Index. Let’s dive into the charts and see the variety of reasons to believe this may be the case.
1. Strong Fear and Greed Index Action
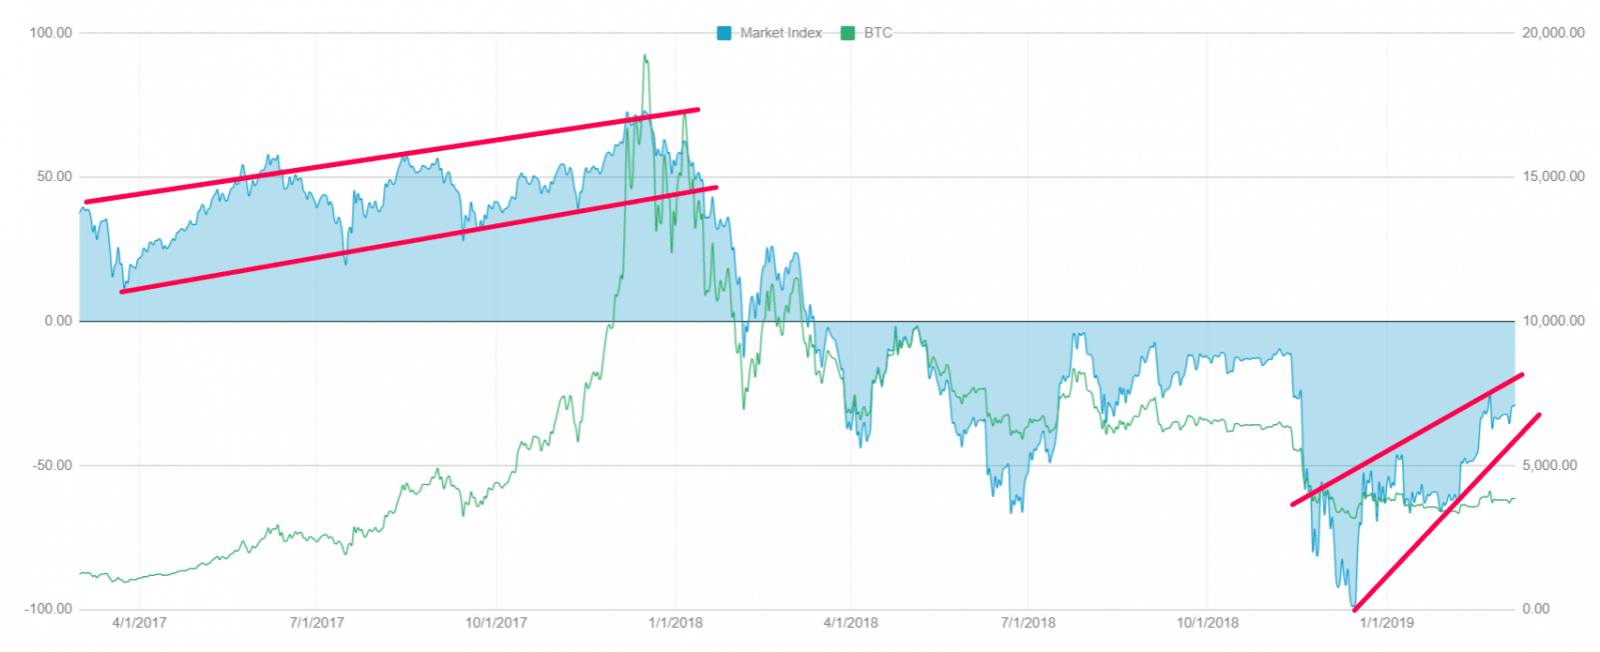
BTC Price, as you’ll see, has been relatively flat in 2019 (see the red line below).
However, the Fear and Greed Index has begun increasing (approaching zero) quite rapidly.

2. Extreme Reading Indicates Oversold Conditions
Many technical indicators act best as ways to identify reversals. For example, traditional analysts will use RSI, Bollinger Bands, and Stochastic Oscillators to identify overbought and oversold situations.
Similarly, the Fear and Greed Index typically moves between +100 and -100. It’s uncommon for it to hit ranges beyond 50.
Back in December of 2018, the Fear and Greed Index hit a -97, which is nearly as extreme as it gets. This may indicate the market is heavily oversold.
The most other extreme reading over the last two years was the one preceding the crash, where the Fear and Greed Index hit +73. That gives you perspective on just how oversold the market may currently be.

3. Channel Breakouts
Applying traditional charting techniques, we can also see the Fear and Greed Index displays channeling behavior that seems to follow its own support and resistance lines.
The Fear and Greed Index both hit a peak (overbought) and then subsequently broke the resistance channel in early 2018. This was the onset of the market drop and proceeded the massive fall in prices that ultimately put us in our extended bear market phase.
Looking at our current situation, we do see the peak low (oversold). We also see support and resistance lines forming. Additionally, the support channel is making higher lows, which is bullish as well.
If the Fear and Greed Index breaks out above that overhead resistance line, that will likely be a very bullish indicator.

4. Pivotal Price Point
In addition to all of the above, there is interesting historical behavior in our current price range. As noted, most of 2019 has been stuck in this channel. Looking back at the end of 2017, we also saw a period of time spent in this range. Once price moved out of this range, the parabolic move began.
This is not to say a parabolic move will happen again, but it is to say this is certainly an emotional and historic price point.
Combined with the points above, it makes our current point that much more compelling.

5. Trades Signaling BUY
Last, the Trade Alerts have recently flipped to “BUY” status (except for BCH at this point).
These trades are reopening following on the exceptional trades that just closed a couple of weeks ago that locked in 30%+ profits.

Conclusion
We have a convergence of indicators showing we may be at the point where the overall paradigm is changing. Most interesting is the fast upward trend in the Fear and Greed Index despite the flat price action.
Of course, cryptocurrency could continue down. But if you believe in the fundamentals, perhaps this is all highlighting we’re at a point where accumulation for the long-term makes sense on multiple levels.
What do you think?
About Crypto-ML
Whether you want to own 1, 10, or hundreds of bitcoins, we strive to help you realize your goal faster. Learn more and join for free.
Subscribe to the Newsletter
Join 7k+ working professionals to "The Five-Year Plan". Every Saturday morning, you'll receive one actionable tip to create life-changing wealth in crypto.