Video: Did Bitcoin just peak? What the Fear and Greed Index is telling us.
Bitcoin just hit a new all-time high of around $67,000. While this is very exciting for crypto traders and investors, it can also be stress-inducing. If you have a large unrealized gain on a longer-term investment, you may wonder if it’s prudent to take profit.
After all, Bitcoin can move up very quickly, but it has had a tendency to crash just as fast. The Fear and Greed Index is designed to help us get a sense of the bigger picture and manage our positions.
While Bitcoin will likely continue to go up over the long haul, it’s very possible we’ll see a drop at some point. Markets move in cycles. It’s even possible we’ll see a slump that lasts for a year or more. If price does go down to $28K-$30K, it would be great if you could sell some or all of your position now, then begin buying back in at that lower level.
In this 11-minute video, I’ll cover:
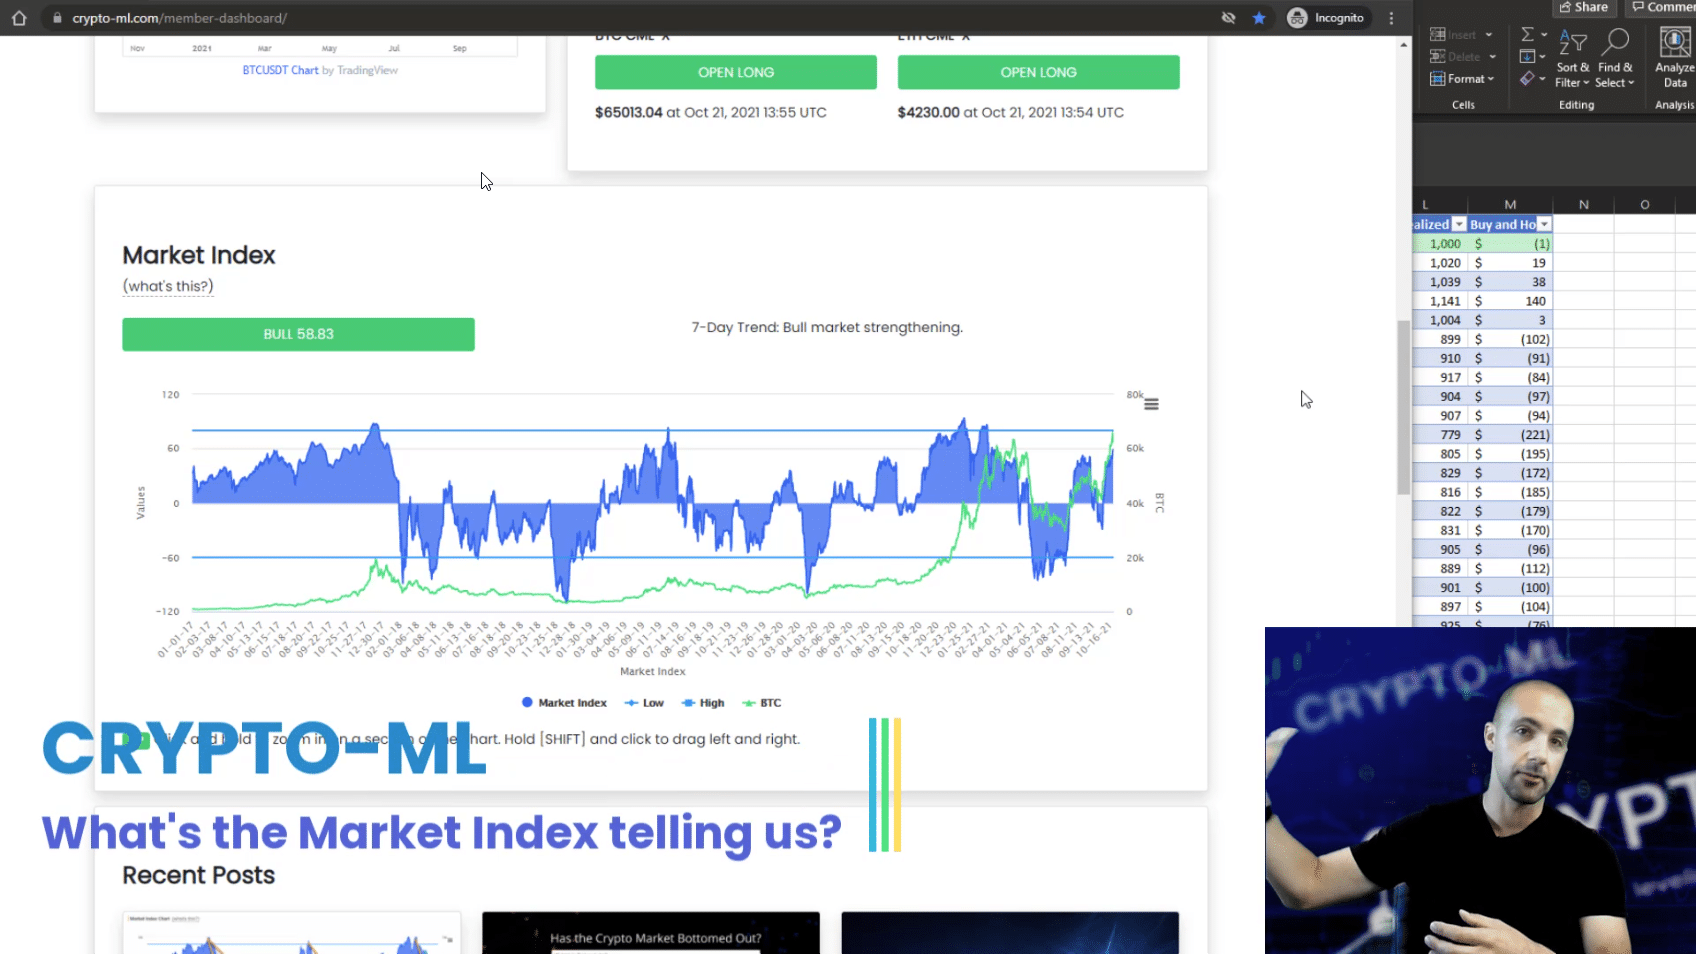
- What the Fear and Greed Index is telling us.
- A simple simulation of using the Fear and Greed Index to make long-term decisions.
You can also hop to a summary below the video to cut to the chase.
What is the Fear and Greed Index telling us?
Video Summary
- The Fear and Greed Index combines technical and sentiment data. This data can hit extremes which may indicate market tops and bottoms.
- Currently, the Fear and Greed Index is at about 59. This indicates this rally still has room to run.
- Starting at 5:20, I show how you can download our Fear and Greed Index data and run simple experiments.
- While the experiment I run is very simplistic, it still greatly outperforms buy-and-hold.
Fear and Greed Index Quick Review
The Fear and Greed Index combines technical (exchange and indicator) and sentiment (social and search) information to build a “big data” view of how extreme the long-term market may be.
The Fear and Greed Index will indicate:
- A potential top if price has extended up unusually quickly and people tend to be over-exuberant.
- A potential bottom if price has dropped unusually quickly and people tend to be in deep despair.
Learn more about the Fear and Greed Index.
Simulation Results
In the video, I discuss my personal approach to “Dollar Cost Averaging” for my long-term Bitcoin investments. That strategy is more sophisticated than the simple experiment I demo. But even though the experiment is simplistic and therefore misses opportunities, the results are still phenomenal.
- Assuming a $1,000 initial investment on January 1, 2017, I’d exit on October 1, 2021 with $259,433. That’s a whopping 25,843% gain!
- Buy-and-hold during this same time would take that $1,000 and turn it into $64,906. While also impressive, it’s much lower.
This simulation shows the power of realizing gains during long-term peaks and then reinvesting it when prices drop back down again.
Conclusion
The Fear and Greed Index pulls in a huge array of data to help provide a big-picture view of the market. It is available as part of our Free Account. If you’re not already signed up, check out our free and paid plans at https://crypto-ml.com/pricing/.
Subscribe to the Newsletter
Join 7k+ working professionals to "The Five-Year Plan". Every Saturday morning, you'll receive one actionable tip to create life-changing wealth in crypto.