CTO’s Technical Analysis of Bitcoin: Aug 16, 2021
Sinjin Smith – CTO 8/16/2021
72-Hour Prediction
With everything the charts are saying, I expect BTC is likely to pull back to Support 2: $43,8XX.
Daily Chart Analysis for Bitcoin
Daily charts are a good indicator of what the next 2-3 weeks will look like. I always start on the daily chart so I can see if we are in a bull, bear, or consolidating market.

The daily chart above is showing us that we are in a ranging triangle (orange lines) that is tightening. Several other indicators are showing weakness. The rally has diminished and showing signs of a pullback.
If BTC crosses under 46K, look for the 43K area to act as support.

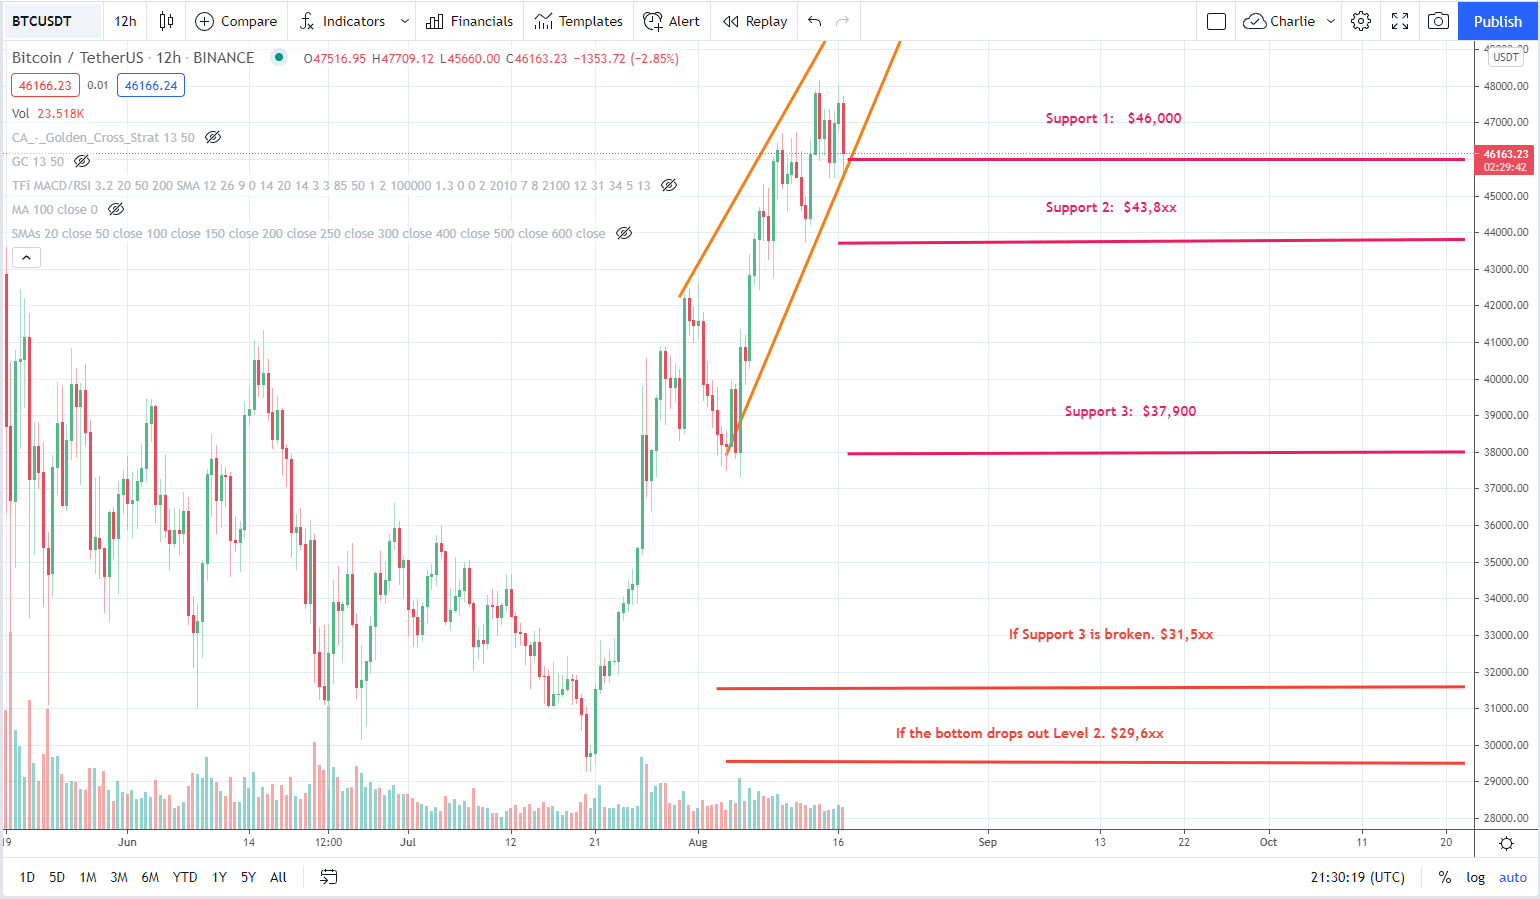
Twelve-Hour Chart Analysis for Bitcoin
Twelve-hour charts are my bread and butter. Manual trading decisions start with the 12h charts. 12h charts give an outlook of the next 1-3 weeks, depending on the market.
- Bull: 1 week
- Bear: 1-2 weeks
- Consolidation: 1-3 weeks
Daily lines are superimposed on 12h candles. You can see the price ranging inside the orange “ranging triangle”. A cross under Support 1 ($46K) could lead to Support 2 ($43,8xx). Volume is decreasing. Overall, the bulls have slowed down their momentum and the bears are trying to push for a correction.

One-Hour Chart Analysis for Bitcoin
The 1-hour chart is really good for making that final manual trading decision. If after analyzing the daily and 12-hour charts, I have decided it’s a good time to buy, then I want the best possible entry so I look at the 1-hour chart.
If I see that the price is close to the bottom of the ranging triangle, I would put in my limit order near the bottom of the triangle. In this case, the daily and 12-hour charts are both showing weakness (across many different indicators that measure volume, price action, intensity, and many other), so this is a NO buy situation.
CML-T-BTC is suffering a drawdown right now, waiting for the correction and the next rally, depending on how long the correction lasts, CML-T could stop loss out.
2 thoughts on “CTO’s Technical Analysis of Bitcoin: Aug 16, 2021”
Leave a Comment
Subscribe to the Newsletter
Join 7k+ working professionals to "The Five-Year Plan". Every Saturday morning, you'll receive one actionable tip to create life-changing wealth in crypto.
Very good Ideas
Thanks.