CTO’s Technical Analysis of Bitcoin: Sept 06, 2021
Notes From CTO
Technical analysis (TA) comes in many forms. Indicators include SMA, RSI, MACD, Bollinger Bands, and hundreds of others. TA can also include shapes, which come in many forms, such as channels, resistance, support lines, triangles, and more.
TA is very subjective. Something I see as a pattern, others might not see and instead pick up on a different one. This is okay and is a good thing. We all have different trading ideas, systems, and patterns we learn to identify and trust.
Why am I going over this?
While TA is a great tool, traders need to keep their eye on other factors too.
What’s going on with Social media? What’s going on with mainstream news? What’s going on worldwide? News from exchanges? Hacks? SEC court cases? There are many factors a trader needs to look at in order to click that “buy button.”
The key to consuming all of this data in order to make a trade is very simple but yet quite complex. Critical thinking and discernment are paramount. These two words are often used interchangeably but are quite different.
- Critical thinking is being rational, open-minded, and informed by evidence.
- Discernment is the quality of being able to grasp and comprehend what is obscure. It’s acuteness of judgment and understanding.
Critical thinking allows traders to consume massive amounts of data, whether it be a new indicator pattern or a social media influencer pushing a coin.
Discernment allows traders to sift thru the data and judge it. Does this social media influencer resonate with me? Does this new Bloomberg article send off alarms in my gut? I like to call it my “Spidey-Sense” (for Spider-Man fans!).
As I consume data, I constantly check my Spidey-Senses.
In closing, as a trader, you are playing with real money. Check your ego, feelings, and FOMO at the door. Let your own personal Spidey-Sense and critical thinking take over.
72-Hour Bitcoin Price Expectations
Barring big news, world events, I anticipate zig-zagging with a good possibility of testing the bottom of the orange channel and bouncing to new resistance.
The new channel plus new resistance is getting quite narrow. BTC is getting boxed inside. This is why we have channels, support, and resistance lines: so we traders can make informed decisions on when to let it ride or get out.
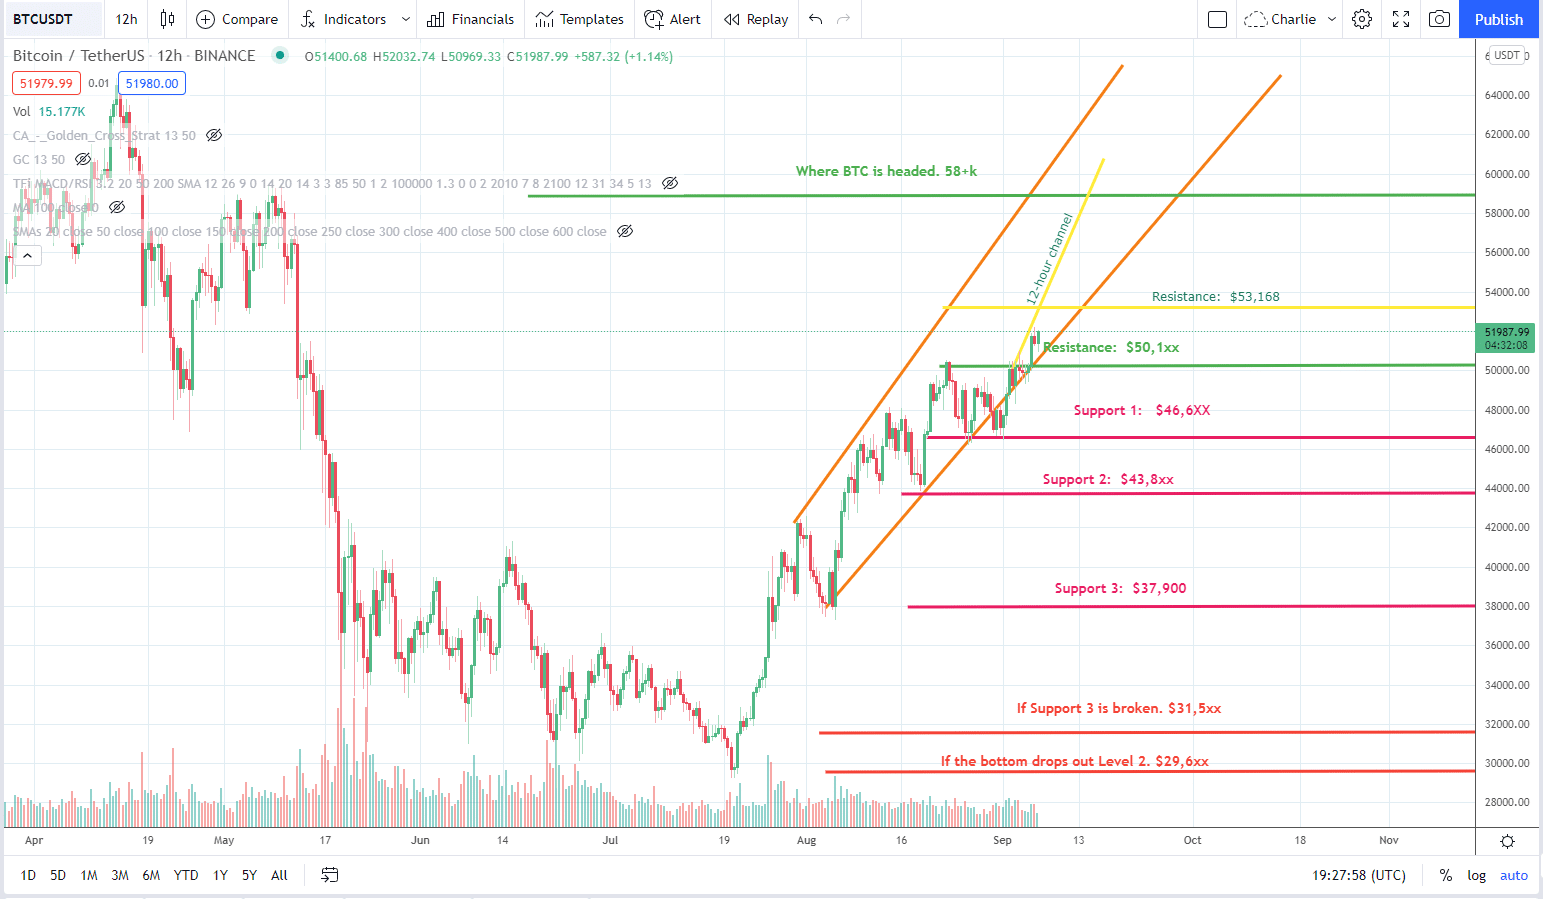
Bitcoin Daily Chart Analysis
Support 1 has moved up to $53,168.
The orange channel has been very reliable in the past several posts. Price action seems to be playing within these borders, which has provided more trade opportunities on the 1-hour charts!
Daily indicators are still zig-zagging while moving up.

Bitcoin 12-Hour Chart Analysis
- New channel: yellow top and orange (daily) bottom channel.
- New resistance: $53,168
- Indicators are starting to top out but there is some room for zig-zagging.

Bitcoin 1-Hour Chart Analysis
Currently price is sitting in the middle of the new channel (yellow/orange) and is sideways.
Indicators are showing a zag in process but price is basically stagnant. It will be interesting to see what price does as the 1-hour indicators start to cycle.

Bitcoin 1-Hour Chart Trade Opportunities
- Green arrows: Buy
- Red arrows: Sell
- First trade: 2.95+%, 8 hour trade
- Second trade: 3.00+%, 5 hour trade
- Target total: 5.95+%

One thought on “CTO’s Technical Analysis of Bitcoin: Sept 06, 2021”
Leave a Comment
Subscribe to the Newsletter
Join 7k+ working professionals to "The Five-Year Plan". Every Saturday morning, you'll receive one actionable tip to create life-changing wealth in crypto.
Like