CTO’s Technical Analysis of Bitcoin: Oct 14, 2021
72-Hour Bitcoin Price Expectations
CHOP! CHOP! CHOP! Expect to bounce in the Daily Channel.
The next 12-hour candle close will determine our next direction. Right now, the 1-hour charts are showing bearish movement. As I write, the 1-hour candle has rejected Indicator Y’s cross under. This is how fast the market moves!
Will need to see how the 1-hour candle closes. Will it be over or under Indicator Y? A rejection (over) could spark an uptrend. If it’s under, price will head toward the Daily Channel bottom.
…and now it has crossed under and back over Indicator Y. Wow! The indecision in the market is incredible.
Bitcoin Daily Chart Analysis
NOTE: Lines and channels in black are now defunct. But I am keeping them on the charts for reference.
- Daily Channel is holding strong. The latest daily candle tested Resistance (the green “Where BTC is headed” line).
- I suspect more chop inside the Daily Channel and would not be surprised to see a pullback while indicators reset.
- Indicator Y is sideways and topped out. (Pic 1)


Bitcoin 12-Hour Chart Analysis
This view provides a closer inspection of the chop inside the Daily Channel. We need to wait to see how this candle closes (UTC):
- If the candle closes RED, I believe the bottom of the Daily Channel will be tested.
- If candle closes GREEN, I believe the top of the Daily Channel will be tested.
The market is very uncertain as I write this blog post. The current candle is constantly flipping from green to red and has significant wicks. Perhaps the 1-hour will show me more!


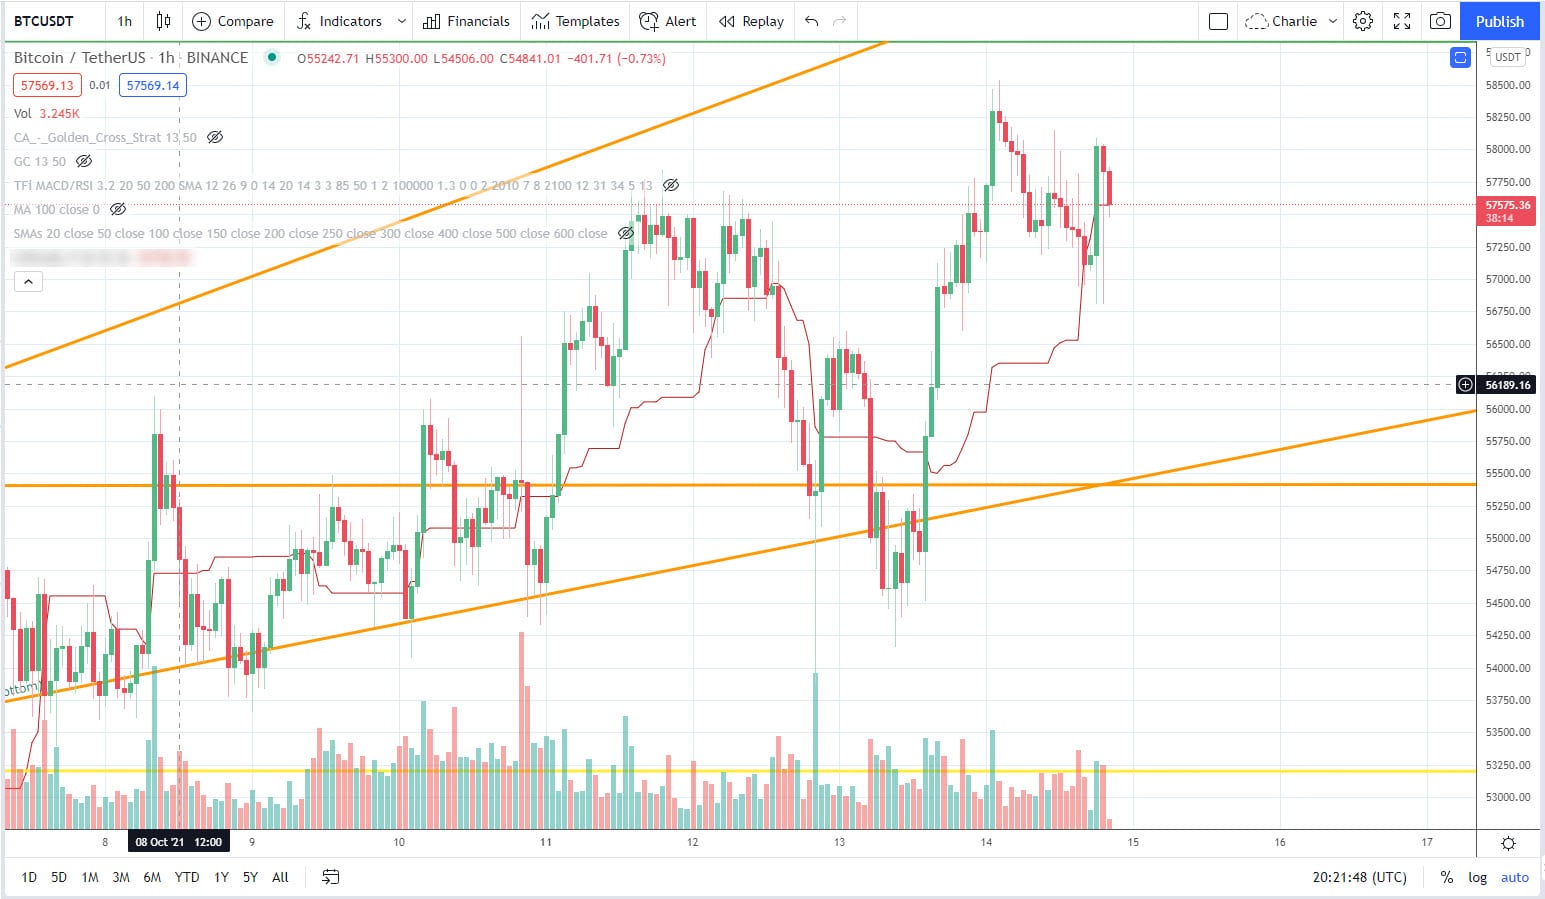
Bitcoin 1-Hour Chart Analysis
Now we can see why the 12-hour candle is fluttering from green to red!
Price action just crossed under Indicator Y. Now we wait to see if price action sustains under Indicator Y.
If price sustains under Indicator Y, there is a good possibility the bottom of the Daily Channel will be tested. Indicator Y is proving to be a strong indicator of directional momentum.

Subscribe to the Newsletter
Join 7k+ working professionals to "The Five-Year Plan". Every Saturday morning, you'll receive one actionable tip to create life-changing wealth in crypto.