Crypto-ML Bitcoin Price Channels
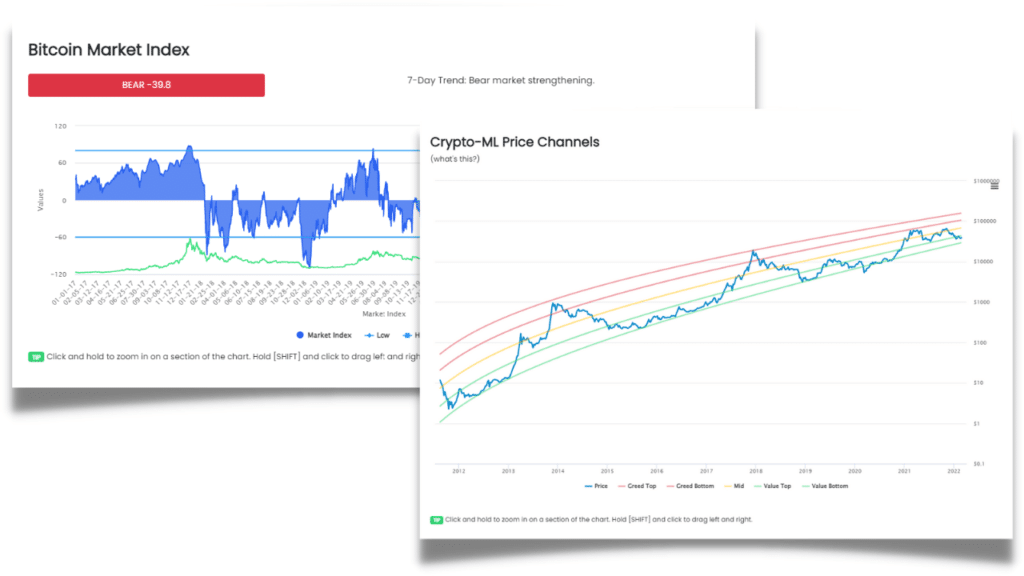
Crypto-ML offers unique Bitcoin price channels that help identify statistically-likely ranges of future price movement. The Crypto-ML Price Channels graph pairs with the Crypto-ML Fear and Greed Index to provide a more complete picture of the crypto markets.
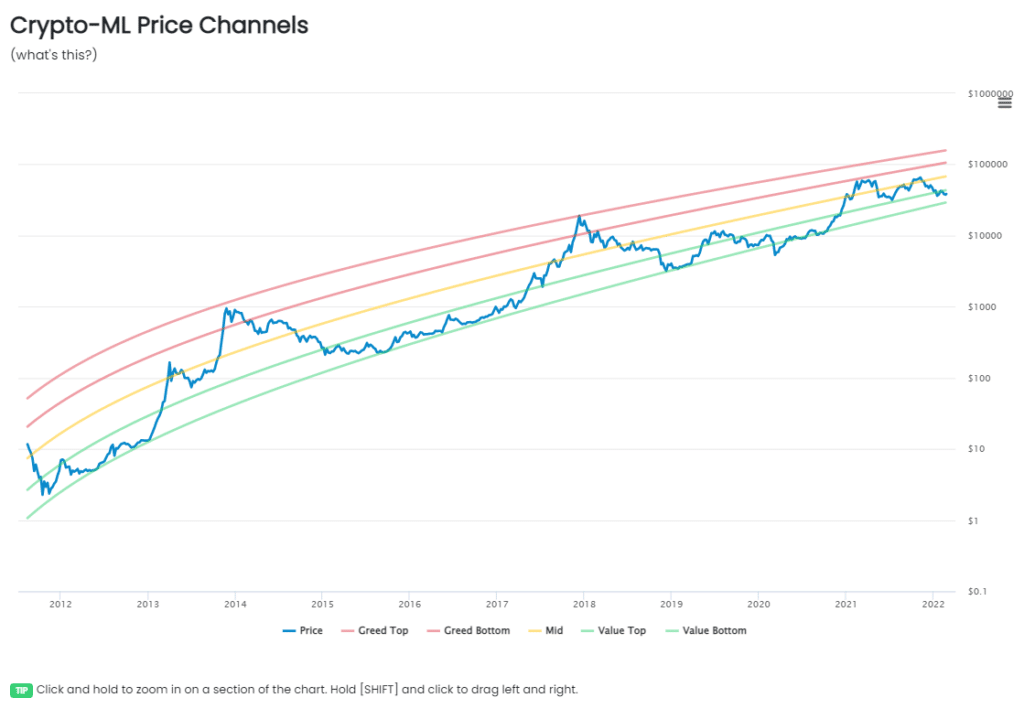
The Crypto-ML Bitcoin Price Channels are regression curves that provide amazingly simple structure to over a decade of wildly volatile data.
As an aside, the Bitcoin Price Channels are also designed to help investors focus on the long-term, big picture. This can help you reduce stress and make better decisions.
Video Walkthrough
How to Use the Bitcoin Price Channels
The Bitcoin price channels show the statistical distribution of Bitcoin price data over its entire history. Your investment decisions may vary based on where Bitcoin price is within the channels.

Green Channel
When Bitcoin is in the green channel, it is likely a good time to invest in Bitcoin. This, of course, assumes you believe Bitcoin will increase in value over time.
Entering the green channel will likely correspond with the Fear and Greed Index showing Fear or Extreme Fear.
Red Channel
When Bitcoin is within the red channel, it is time to be cautious and consider taking some profits. Red corresponds to extreme highs and market peaks.
Entering the red channel will likely correspond with the Fear and Greed Index showing Greed or Extreme Greed.
Exceeding the Model
Bitcoin has only broken this model once, which was during the COVID crash in March of 2020.
This was an extreme time when most markets, including traditional investments, crashed. However, this ended up being an exceptional time to buy Bitcoin.
This means extreme global events may cause price to exceed the model’s thresholds. If you believe nothing has fundamentally changed about Bitcoin, any exception may be an outstanding time to accumulate.
On the other hand, it is possible this model will be invalidated at some point in the future. That would be driven by fundamental changes to Bitcoin that dramatically reduce its long-term value proposition.
Predicting Market Tops and Bottoms
As you look at the Crypto-ML Bitcoin Price Channels, you can see the ranges in which Bitcoin is likely to move.
The Fear and Greed Index may tell you the market is in “Extreme Fear,” which typically indicates a good buying opportunity. But it doesn’t give you information on where the market may likely reverse. That is where the Crypto-ML Channels come into play.
Predicting Market Bottoms
As of this writing, Bitcoin is sitting around $38,000 and has been in a bearish mode. Looking at the Bitcoin Price Channels, I can hover over the bottom green band and see it is plotted at $29,000.
That means this model sees a worst-case of $29,000. I can invest in some Bitcoin now but should be prepared for it to potentially drop another 24%.

Since no predictive tool is perfect, I should consider this data along with the Fear and Greed Index and my own fundamental analysis to determine if I believe this is a solid entry point. And rather than going “all in,” I can consider phasing my investments in over a variety of price points within the green channel.
Predicting Market Tops
Similar to market bottoms, you can hover over the red lines to see explicit values. As these values are hit, consider taking some amount of profit over time.
While it is very unlikely you’ll exit at an exact peak, if you bought in the green channels, you have almost certainly made excellent returns that you can capture and reinvest in the future.
Better Together
The Fear and Greed Index has been referenced throughout this guide because the Bitcoin Price Channels are meant to be used with it.

- The Price Channels utilize only one data point, which is price.
- The Fear and Greed Index is a sophisticated combination of many data points that attempt to quantify market sentiment.
While the Fear and Greed Index is a much more robust tool, the Price Channels help answer a different question. They provide a clear picture of statistically-likely reversal points.
When the information from both tools is combined, you can gain much more clarity into the overall market picture.
How the Price Channels are Generated
The Crypto-ML Price Channels look unique because:
- The y-axis (Bitcoin price) is represented on a logarithmic scale.
- The x-axis (time) is represented on a weekly interval.
Looking at the data in this manner provides a clearer visual of assets, such as Bitcoin, that have a long-standing trend.
In terms of the channels:
- The channels are made up of statistical distributions where price tends to cluster.
- The lines themselves are similar to polynomial regression lines, which mathematically minimize error and find the best fit of data.

What is so impressive about this chart is the uniformity and smoothness that extends all the way back to 2011. We do not need to rely on complex regression lines that wave up and down over time.
Advanced Bitcoin Price Channel Actions
For those of you that like to dig into the data, we provide a variety of tools you can use.
- Zoom: to zoom into the chart, simply click and drag over the area you want to zoom in on.
- Pan: once zoomed in, you can pan left and right by holding [SHIFT] and clicking.
Download the data
You can also click on the hamburger icon on the top right and download the raw data. With the data, you can perform your own detailed analysis and modeling.

Conclusion
The Crypto-ML Bitcoin Price Channels are designed to be paired with the Fear and Greed Index in order to provide you with powerful perspective on the big-picture of the crypto markets. Questions or comments? Let us know below.