Strong Bearish Indicators for Crypto Market Continue
While prices are up about 28% year-over-year, our machine learning platform is continuing to give strong bearish indicators for the crypto markets and as such, we are urging caution ahead. As you may have noticed, the crypto markets have dropped over 25% from the June highs. We’ve also seen very sharp downward pressure over the last couple of weeks.
About two and a half weeks ago, we first covered the convergence of bearish posturing across each of our indicators in our post Crypto Market Analysis – Bearish Indications. This post highlighted several important changes across all of our models, including:
- Tighter Stop Losses
- Weakening Fear and Greed Index
- Closing Trade Alerts
- Dropping Trade Meter
The post also gave some recommendations for both traders and investors. Ultimately, this was a warning to our customers about the markets ahead.
Recent Trade Action
Since that post, several trades have opened and quickly closed. Our machine learning tends to look for breakout opportunities during times of consolidation.
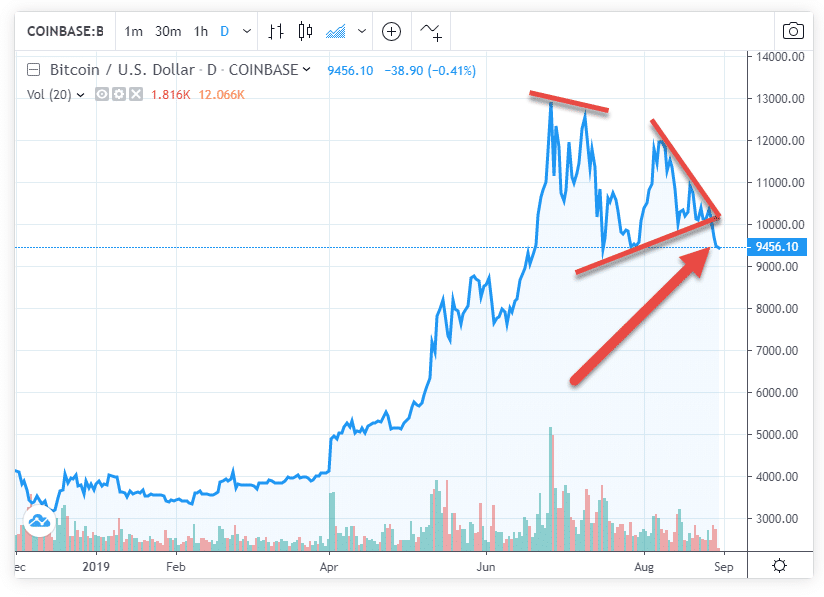
As prices tightened, they began forming a descending triangle, which is characterized by a tightening trading range, where the resistance line (top) goes down faster than the support line (bottom) goes up. In traditional technical analysis, this is a bearish formation.
Indeed, once the lines converged, price broke out sharply below the support line.
As mentioned, in a case like this, we tend to see our models open trades around the top (resistance) lines as opposed to the bottom. While this may result in a loss, the models seem to accept this risk for the possibility of a breakout. Some traders prefer to open trades at the bottom (support) line. This may give a better probability of a small bounce, however, the risk of a blitz breakout downward is significant.
It should also be noted that our models consider a broad set of data and also consider the inputs of many traditional technical indicators. So while we cannot say that is exactly following the support and resistance of this triangle, past behavior seems to indicate that it generates similar target points.
It’s also possible for the models to adjust behavior based on this recent data and begin trading differently in the future. That’s the beauty of machine learning.
If you’d like to chat more about this topic, we have a good discussion going in the Community Forums here.
Fortunately, our trade signals all closed prior to the very fast drop on August 28th.
Crypto Market Sees Red as Bitcoin Price Drops $600 in 30 Minutes (Coindesk.com)
Bitcoin Plunges $1,000 in a Few Hours as Crypto Markets Quake (NewsBTC.com)
Litecoin had a brief opening today in an attempt to catch a bounce.

Regardless of the trading system, there will be losses. In the end, it is a numbers game. Our Trade History has shown that a string of losses in pursuit of a large gain can achieve results that exceed traditional methods.

Fear and Greed Index Below Support
Like the price chart above, the Fear and Greed Index has been developing its own bearish pattern. It is returning lower highs and lower lows. It also broke through the support line.

As of today, the Fear and Greed Index has dropped even further and is sitting at an 8.5 value. It may move into an official “BEAR” position in the next few days.
Intelligent Stop Losses: Even Tighter
After the recent trade closes, our models have tightened the stop loss guidance even further. This means the risk of adverse movement is high.

During more bullish times, these stop losses will typically be in the -3% to -5% range.
Some crypto issued tighter stop losses a couple of weeks back, but additional tightening has since occurred in BCH and LTC.
Recommendation
Our recommendations based on this data have not changed.
If you’re a trader:
Our collective data modeling urges caution. According to our Fear and Greed Index, we’re still in a bull market, but it appears to be nearing an end–at least for now. The reality is, no one and no machine knows exactly what will happen next. But we like to have the data and machine modeling in our corner.
Practically, we will employ tighter stop losses and smaller trades. If we do cross into bear territory, it will be time to seek short trades.
If you’re an investor:
Investors believe in long-term price increases for crypto. Investing is very different than trading–rather than swimming with the current, you want to operate counter the market. Just like real estate investors who gobble up houses while everyone else is foreclosing, a crypto market pullback could be welcome.
This data seems to indicate we’re nearing another accumulation opportunity.
About Crypto-ML
Whether you want to own 1, 10, or hundreds of bitcoins, we strive to help you realize your goal faster. Learn more and join for free.
Subscribe to the Newsletter
Join 7k+ working professionals to "The Five-Year Plan". Every Saturday morning, you'll receive one actionable tip to create life-changing wealth in crypto.