What does Bitcoin price history tell us about future price?
If you’d like to know where Bitcoin and other cryptocurrencies are headed, you aren’t alone. This is a question answered differently by experts on a daily and even hourly basis. You can attempt to answer this question by looking at the fundamental market need for the technology, or by performing a technical analysis of price.
Regardless, both are extremely challenging and neither perfect.
Looking at a visual snapshot of where we currently stand with price, you may recall similar patterns through Bitcoin’s history:
Bitcoin Price Chart 2014

Bitcoin Price Chart in 2016

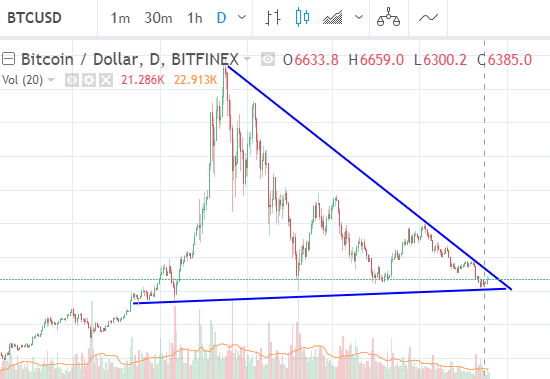
Bitcoin Price Chart 2018
Bitcoin simply has a wild history of massive run-ups in price, followed by slower sell-offs. But the more you look into the details of these and the many other repetitive patterns, the less clear the situation becomes. The less they share in common.
You begin to see differences in time spans, percentage gained, percentage lost, slopes, and where the volume was.
More sophisticated technical analysis paints an even cloudier picture.
What do the technical analysis pros say about Bitcoin?
In case you aren’t convinced that technical analysis of Bitcoin is a challenge, check out this selection of insights from today.
You have a huge variety of interpretations of the same data and a completely mixed set of recommendations. On this page, that’s 3 clear “BUYS” and 4 clear “SELLS.”

So are there really patterns in Bitcoin price history?
With the complexity of finding legitimate patterns in price and similar data, we, of course, turned to machine learning to do the job. The assumption is the important details are in the minutia–an area that is really only suitable for a machine to analyze.
In other words, the human brain just isn’t optimized for a task of this depth and detail.
So far, it has worked out exceptionally well. Crypto-ML has had a tremendous track record (see historical trade data), but just like any other approach, it’s not perfect.
Crypto-ML has been great at capturing the large run-ups in price. If you have been around long enough in crypto investing, you know those spikes can provide unmatched returns. The trick, of course, is getting in at the right time and also out.
When we are in the midst of a longer downtrend, however, Crypto-ML will trigger some losing trades. While these stay small, it’s a reality of ensuring opportunities aren’t missed. The machine brains behind Crypto-ML become smarter with every passing week (example), but users still must anticipate a mixture of small losses along the way to exceptional gains.
Are we ready for the next breakout?
If you take a second look at those first two charts above, you will see that price began moving up strongly after the triangle shapes closed. Are we poised for another big run? Or are there too many differences in the details of those charts? Are the triangles even drawn properly?
Let us know what you think below.
Our money is with the machines.
About Crypto-ML
Whether you want to own 1, 10, or hundreds of bitcoins, we strive to help you realize your goal faster. Learn more and join for free.
Subscribe to the Newsletter
Join 7k+ working professionals to "The Five-Year Plan". Every Saturday morning, you'll receive one actionable tip to create life-changing wealth in crypto.