CTO’s Technical Analysis of Bitcoin: Aug 23, 2021
Interesting few days. In my last blog post, traditional technical analysis was telling me a correction was in play. Well, that was wrong now, wasn’t it?!?!
Diversification in Trading
Technical analysis, AI, algorithms, etc.., will NEVER be 100% correct.
This is why we need a combination approach. I was expecting technical analysis to be wrong at some point in my CTO Predictions, I just didn’t think it would happen so quickly.
CML-A
- 08/19/21: 2.25%
- 08/20/21: 2.31%
- 08/21/21: 1.57%
- 08/23/21: -0.81%
CML-T
- 08-19-21: -2.16%
Overall
- 3.16%
This is just one example of why Crypto-ML created our patent-pending Portfolio Management system. Flexibility and diversification for everyone. Portfolio Management allows for markets to ebb and flow while giving each trader total control over their money.
72-Hour Bitcoin Price Expectations
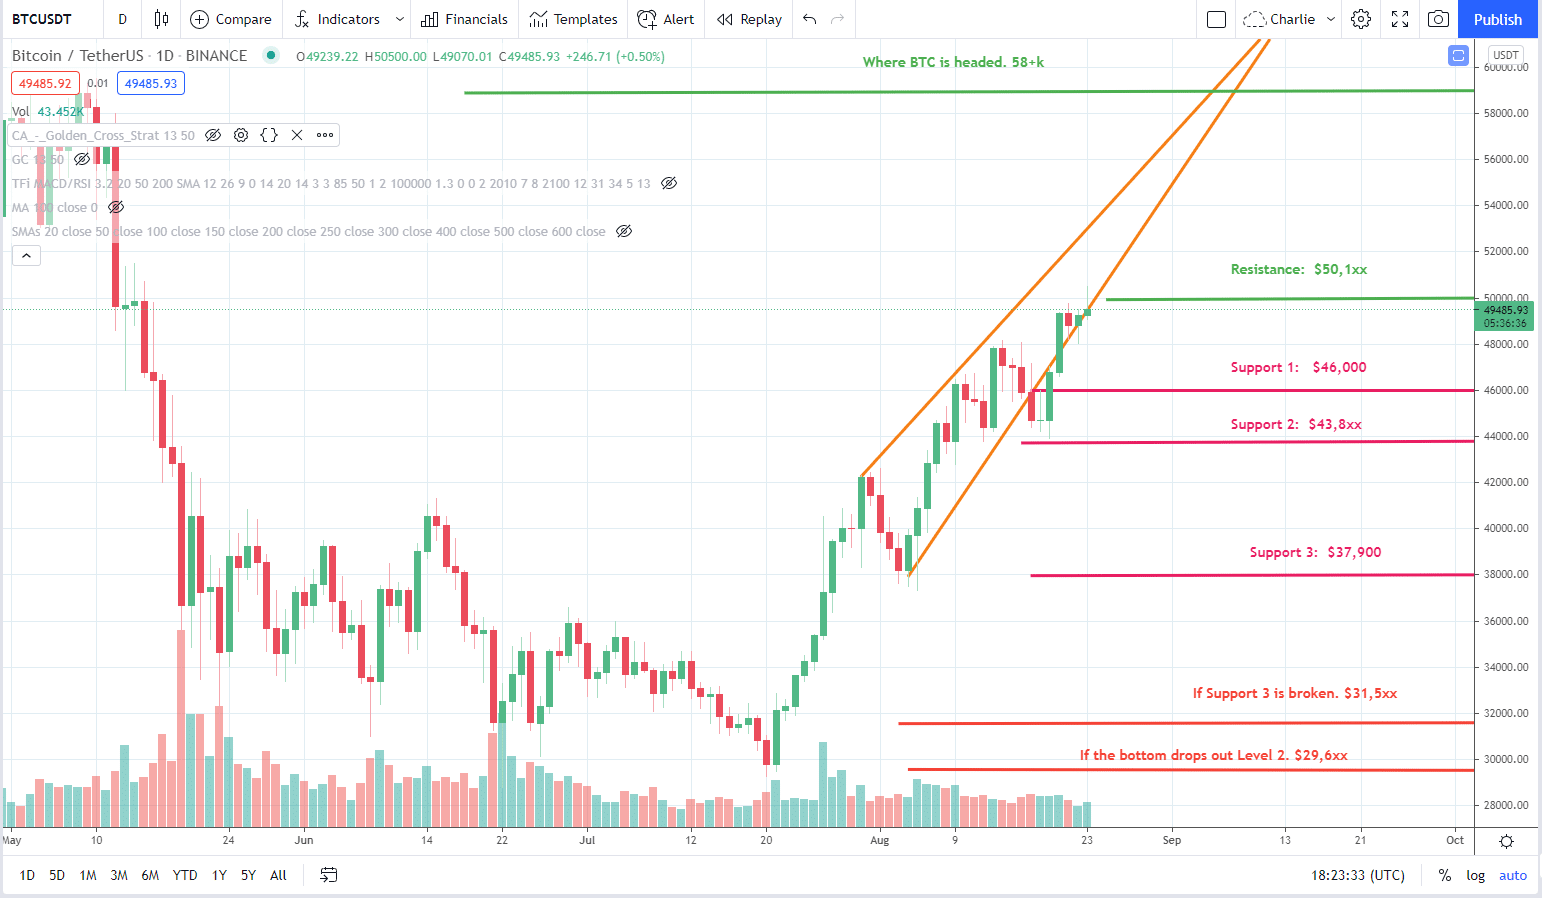
If the resistance at $50,1XX can be broken (price crosses over and sustains that level), BTC could have a nice upswing to $52,XXX. If not, look to support levels.

Bitcoin Daily Chart Analysis
Channel (orange) and Support/Resistances are holding up so far. Price broke through the channel and Support 1 while Support 2 held strong. Support 2 has held through three consecutive tests.
Resistance at $50,1XX has also been tested. The current candle has a wick popping through the resistance and the previous candle got very close.
Most indicators are showing some price movement to the upside. I like to call this type of activity “Zig-Zagging.” This means some indicators are showing a pending price drop, but others are showing a pending price gain. Since the daily is flirting on the edge of the bottom part of the channel (orange) it looks prime for a Zig-Zag event.

Bitcoin 12-Hour Chart Analysis
On the 12-hour, a new channel has formed (yellow).
Resistance has been tested twice now on the 12-hour chart. Both times it was rejected. $50,000 is a mental break for most retail traders and could be one of the reasons why BTC is flirting in the orange channel.
The 12-hour indicators are showing just about the same conclusion daily has shown. Some indicators want price to go down and some want it to go up. Zig-zag it is! Zig-zagging inside the orange and yellow channels until bulls or bears win this fight.

Bitcoin 1-Hour Chart Analysis
Now you can really see all the flirting going around inside the daily channel (orange) and the new 12-hour channel (yellow). You can also see the resistance line (green, far right) has been tested and rejected over the past few hours.
Currently, the 1-hour indicators are “resetting/cycling.” Resetting/cycling is when the indicators are trending down and resetting so that they can start moving back upwards.
Subscribe to the Newsletter
Join 7k+ working professionals to "The Five-Year Plan". Every Saturday morning, you'll receive one actionable tip to create life-changing wealth in crypto.