CTO’s Technical Analysis of Bitcoin: Aug 26, 2021
72-Hour Bitcoin Price Expectations
Over the next 72-hours, technical analysis shows minor Zig-Zagging, a probable cross under Support 1, and then consolidation in-between Support 1 and Support 2. Until I can see who is going to take control (bears or bulls), I will sit out and not take any manual trades.
I will instead let Crypto-ML Portfolio Management handle my trades!
Bitcoin Daily Chart Analysis

The orange channel I’ve been tracking has been updated. The bottom of the channel has moved to form more of a channel and less like a descending triangle.
I have added a new support level, which I”ll call “New Support” for now. Depending on how it holds up, I might have to make it Support 1 and the rest of Supports will renumber.
NOTE: I added “New Support” 48 hours ago as I saw the new level forming.
Today, “New Support” was blown right through after rejecting the cross under for two days straight. Support 1 and bottom of the orange channel are acting is the current support level.
At the writing of this post: BTC is down -4%.
Bitcoin 12-Hour Chart Analysis

The bottom of the orange channel has been tested twice now. This has rejected further downward movement while also testing “New Support”.
There is a possibility of “Zig-Zagging”. This is a good time to become familiar with the Order Book. I generally start with Coinbase Pro’s Order Book if I am going to make a buy or sell decision, I will look at Binance.us if my trade is going to be on Binance.

Buys and sells are close to a 50/50 distribution. I expect price at this point to stay flat.
Here is the rub with checking the order book: it can change in an instant if there is a major correction or rally.
I said previously BTC may Zig-Zag but at this point, looking at the order book, I see price has stalled.
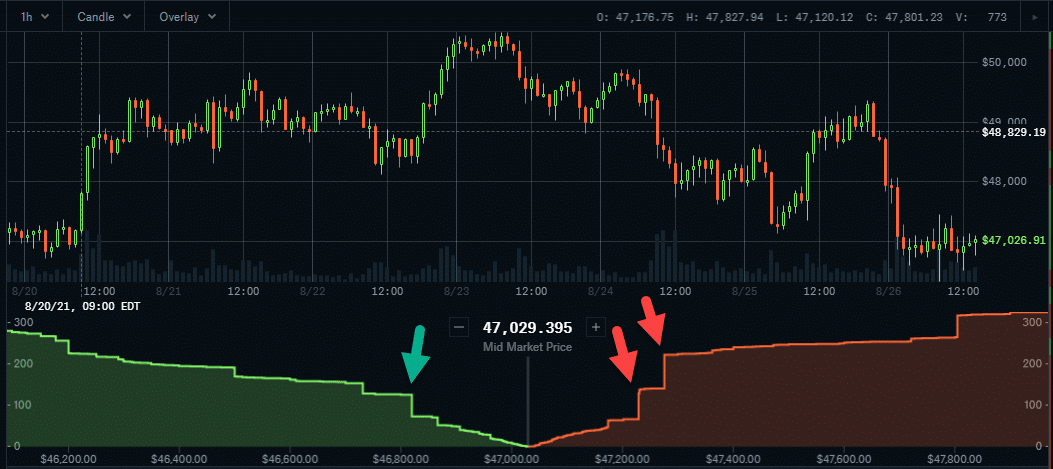
We can also see buy and sell walls on the order book. Currently, it looks like a $47,000 buy wall. There are sell walls at $47,225, $47,250. (Numbers are approximate and change every quickly.)
This also shows indecision which correlates with BTC’s double wicked candles.
Bitcoin 1-Hour Chart Analysis

There is a lot of indecision with the 1-hour candles. There are 12 candles with significant wicks and 2 solid tests of the bottom of the orange channel. There is a new support level forming on the 1-hour candles. Can you see it?
Unfortunately, BTC is showing visibility of Support 1 and Support 2 on the 1-hour chart now! I do not like seeing Support levels on the 1-hour chart! 1-hour indicators are currently showing a “Zag” and price increase.
Answer to “Can you see it?” $46,750
Subscribe to the Newsletter
Join 7k+ working professionals to "The Five-Year Plan". Every Saturday morning, you'll receive one actionable tip to create life-changing wealth in crypto.