CTO’s Technical Analysis of Bitcoin: Sept 02, 2021
Technical analysis (TA) is a great tool to use for predicting market moves but it is not the end-all-be-all. A major inherent problem with TA is that indicators lag behind price and volume action. TA is very susceptible to falling behind major news or catastrophic events.
This is where Machine Learning can bridge the gap and account for the events that TA is lacking. Feeding a Machine Learning model 100s of TA indicators, social data, and several other data points that are outside the TA realm is one of the secret sauces to creating a successful model.
72-Hour Bitcoin Price Expectations
Resistance should finally break, $50,1XX. Where BTC goes from there is the question. The 12-hour chart shows the next resistance at $58,000. Time will tell!
Bitcoin Daily Chart Analysis
I was tempted to move the bottom of the orange channel today but decided to wait until resistance is broken (crossed up) or Support 1 crosses under.
I will be removing the New Support lines as they have exhausted their use. I left them for this post to show a few trade opportunities.
The daily indicators are lining up for a very nice rally. I can see several indicators that are turning the corner. Looks like Resistance should break soon!

Bitcoin 12-Hour Chart Analysis
The 12-hour chart is testing resistance. Looking at the daily chart, this makes complete sense as the indicators are showing they were rounding the corner. Meanwhile, price action holds within the orange channel. A wick tests the bottom of the orange channel. It looks like there could be zig-zagging until the push past resistance, which I suspect will be fast and furious. If you are an aggressive trader this could be a buy opportunity! ($49,150-$49,250)

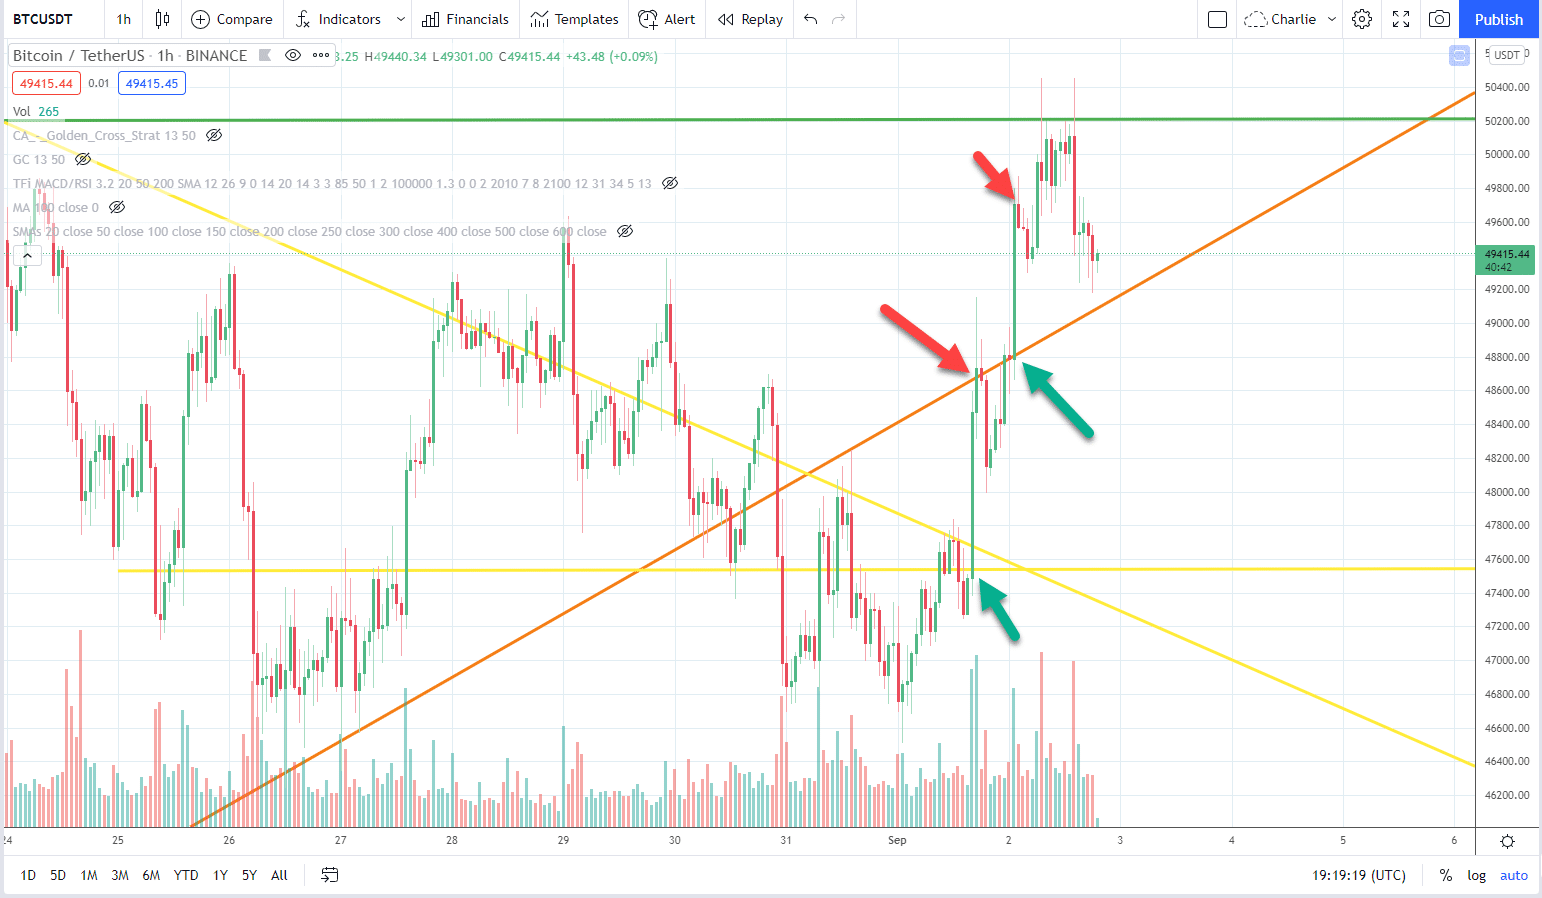
Bitcoin 1-Hour Chart Analysis
The 1-hour has tested resistance six times over the past 12 hours. In the past four hours, we have had a small correction going on as BTC tries to test the bottom of the orange channel. The 1-hour indicators are cycling and look like they have a few hours to go before they round the corner.
I suspect BTC will test the bottom of the orange channel and if price falls through, look to Support 1.

Bitcoin 1-Hour Chart Trade Opportunities
- Green arrows: Buy
- Red arrows: Sell
- First trade: 2.50%
- Second trade: 1.72%
- Target total: 4.22%

Subscribe to the Newsletter
Join 7k+ working professionals to "The Five-Year Plan". Every Saturday morning, you'll receive one actionable tip to create life-changing wealth in crypto.