CTO’s Technical Analysis of Bitcoin: Sept 30, 2021
72-Hour Bitcoin Price Expectations
Price action is holding in the new Channel. I expect price to Zig-Zag inside the new Channel until bulls or bears can take control.
World events are causing confusion, it appears:
- DJI down (-542)
- Evergrande (China corp – 350 Billion in debt)
- Production lines for various products shutting down (aluminum, textiles, automakers)
- Energy issues in various countries (rolling blackouts)
Personally, I would sit on the sidelines, watching the 1-hour chart and waiting for price action to crossover Support 2. Or, if a correction takes place, keeping an eye on Indicator Y for the next trade opportunity.
Bitcoin Daily Chart Analysis
The previous post price tested Support 2 as resistance and was rejected. Today, Support 2 is testing again, with price currently crossed over Support 2.
I added Interim Support to the chart. Price has bounced off Interim Support six times the past five days.
- Death Cross (13/50) has solidified itself with a $3k spread.
- Indicator Y sideways at $46,260. Very bearish. (Pic 2)
- Indicator X is bullish and still showing signs of a Zag movement (uptick). (Pic 1)


Bitcoin 12-Hour Chart Analysis
While I am writing this post, price has crossed under Support 2! Look at the daily chart compared to the 12-hour charts!
- Price action has created a new Channel: Support 2 (as resistance) and Interim Support (as current Support).
- Indicator Y was tested ‘briefly’ today and rejected. (Pic 2)
- Death Cross (13/50) also solidified. $3k spread.
- Indicator X is bullish for the time being, as you can see, nearing the top. There could be Zig-Zagging incoming. (Pic 1)
- The rest of indicators are reasonably bullish.


Bitcoin 1-Hour Chart Analysis
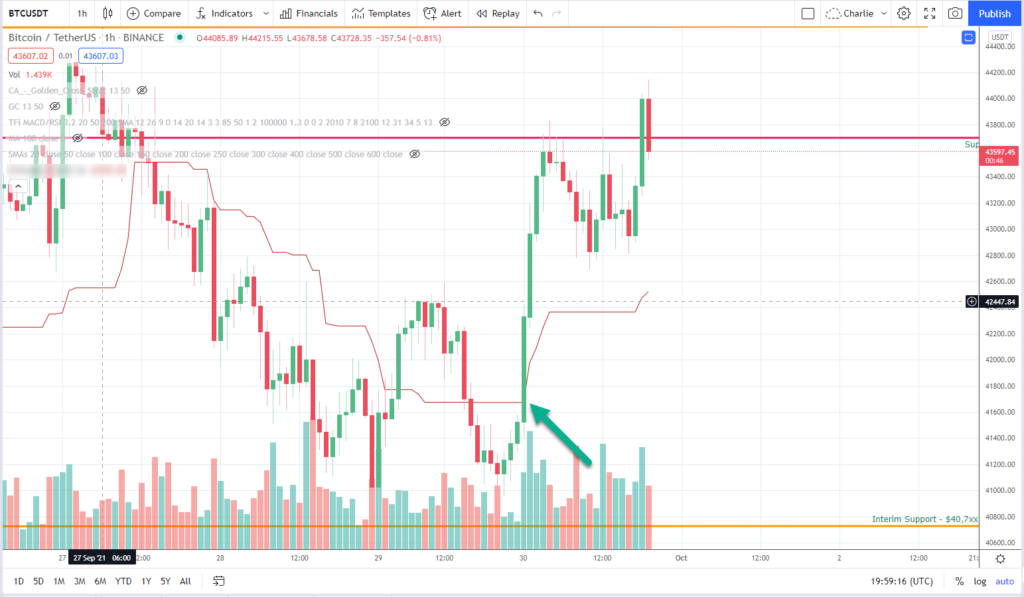
This provides a nice close-up of Support 2 being rejected. Price action crossed over for one candle and quickly retreated back under Support 2.
- There is a trade opportunity (green arrow) when price crossed over Indicator Y (4$ to 5% ROI depending on comfort level)! (Pic 1)
- Solid “ranging” in the new Channel.
- Indicators are nearing completion of this run-up and should start cycling in the next few hours.

Subscribe to the Newsletter
Join 7k+ working professionals to "The Five-Year Plan". Every Saturday morning, you'll receive one actionable tip to create life-changing wealth in crypto.