CTO’s Technical Analysis of Bitcoin: Oct 18, 2021
72-Hour Bitcoin Price Expectations
If price action can cross over Triangle’s top, then I can see a quick uptick to $62+k.
If price action crosses under Triangle’s bottom, price can fall to $61k fairly easily.
Either way, I will watch from the sidelines.
Bitcoin Daily Chart Analysis
Price action broke through Support 1 and Daily Channel Top with strong support from a 13/50 Golden Cross (Oct, 9th).
- Following the breakthrough, Daily Channel Top is acting as support. This is now the third day of testing Daily Channel’s Top as support.
- Indicators are exhausted at the top.
- Indicator X is still maxed out and has been since Oct, 5th! (Pic 1)


Bitcoin 12-Hour Chart Analysis
Price action flirting with Daily Channel Top. There have been six consecutive candles with sizeable wicks.
Indicators are trying to cycle down while price action is moving along Daily Channel’s Top (as support).
Indicator X is finally starting to turn down. (Pic 2)


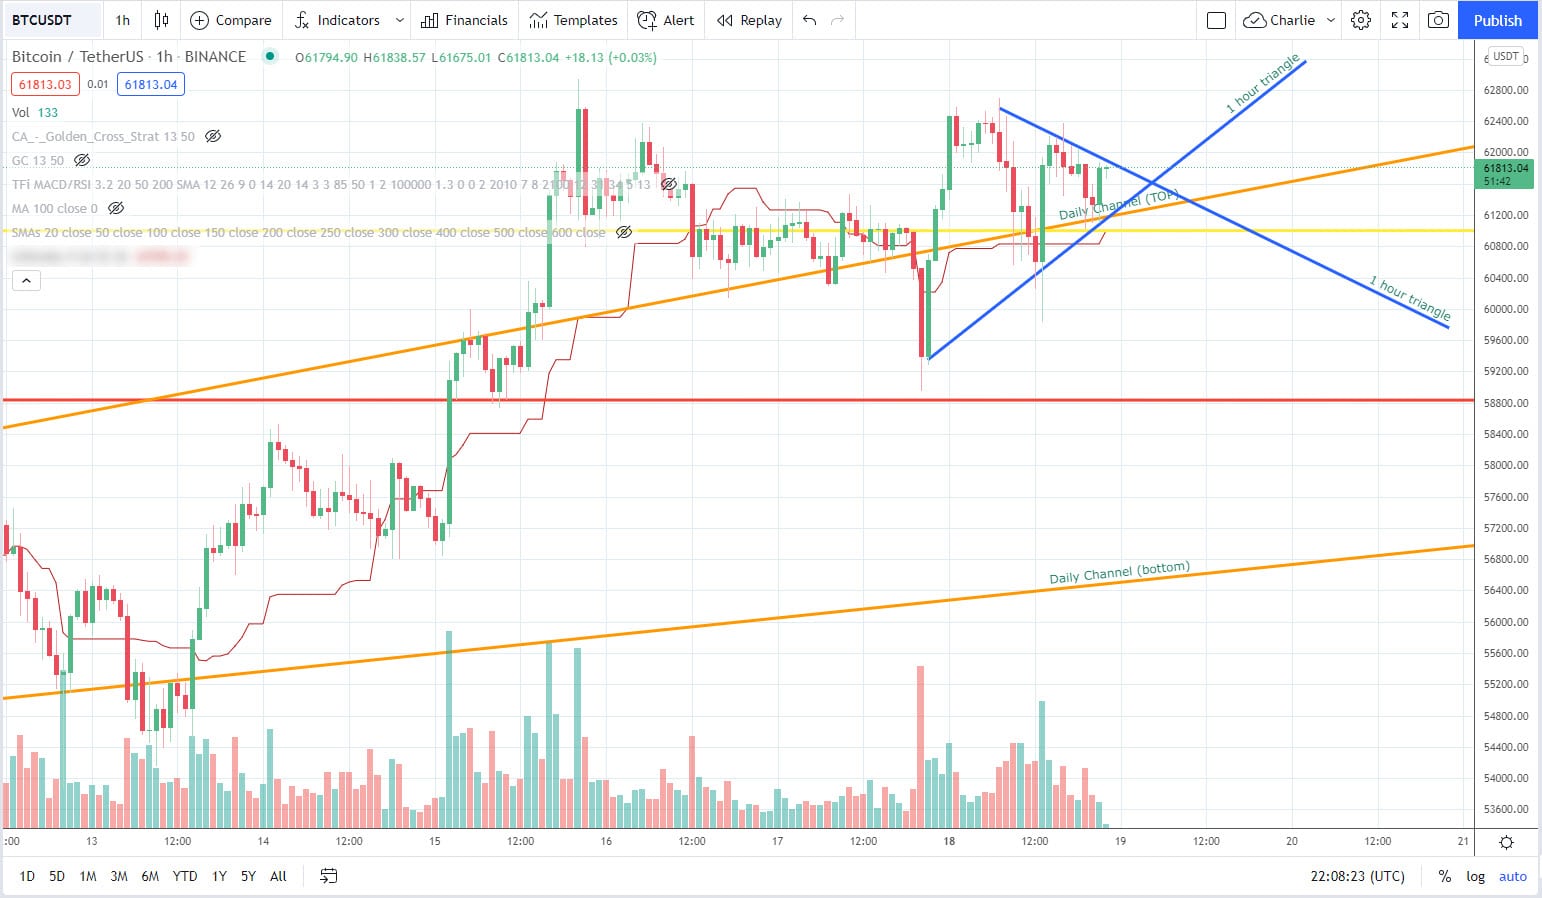
Bitcoin 1-Hour Chart Analysis
Three points of interest:
- Daily Channel Top as support
- “Interesting” line is support from previous candles
- Indicator Y shows fallback support
These three points of interest are crucial to where price action will head.
NEW: 1-hour symmetrical triangle formed. (Blue)
- Crossing over triangle top could push BTC to $62K.
- Crossing under triangle bottom could drop BTC to $60,6xx.
Indicators are zig-zagging.

Subscribe to the Newsletter
Join 7k+ working professionals to "The Five-Year Plan". Every Saturday morning, you'll receive one actionable tip to create life-changing wealth in crypto.