CTO’s Technical Analysis of Bitcoin: Aug 19, 2021
72-Hour Prediction
Over the next 72 hours, Bitcoin will hit Support 2 ($43,8XX) or be very close to it. There are many indicators showing strong bearish movements ahead. I have ZERO indicators supporting bullish movement. The indicators I personally use are showing bearish movement ahead.
Caution: This current little bump (4%) is a FAKE OUT!
Remember this is a 72-hour prediction and is not indicative of longer-term movement
Daily Chart Analysis for Bitcoin
FAKE OUT in process! There is currently a 4% rally on the daily chart. Luring in retail for a major correction, typical move by the whales, institutions, market manipulators to bilk retail’s cash!

Looking at my trend lines (orange) from Monday, immediately after posting my blog post BTC crossed under Support 1.
BTC had three tests of Support 2 and bounced off and started heading north (price moves up). You can see the three daily wicks trying to touch Support 2.
The third candle is now testing my support trend line (bottom orange). This test will most likely fail. But wait CTO how can you say that? BTC is already up 4% today!
Keep reading!
12-Hour Chart Analysis for Bitcoin

Showing the fake-out and why BTC fails to cross over my support trend line (orange).
BTC is creating a descending triangle (yellow and Support 2: bright red), look at the intersection of new (yellow) 12-hour trend lines and the daily support trend line (orange). A wick is already forming on the 4% (daily) candle. The candle is shrinking because the bulls are losing power over the bears.
This is classic gamesmanship by the MMs (Market Makers): lulling retail investors into thinking the bull run is starting again.
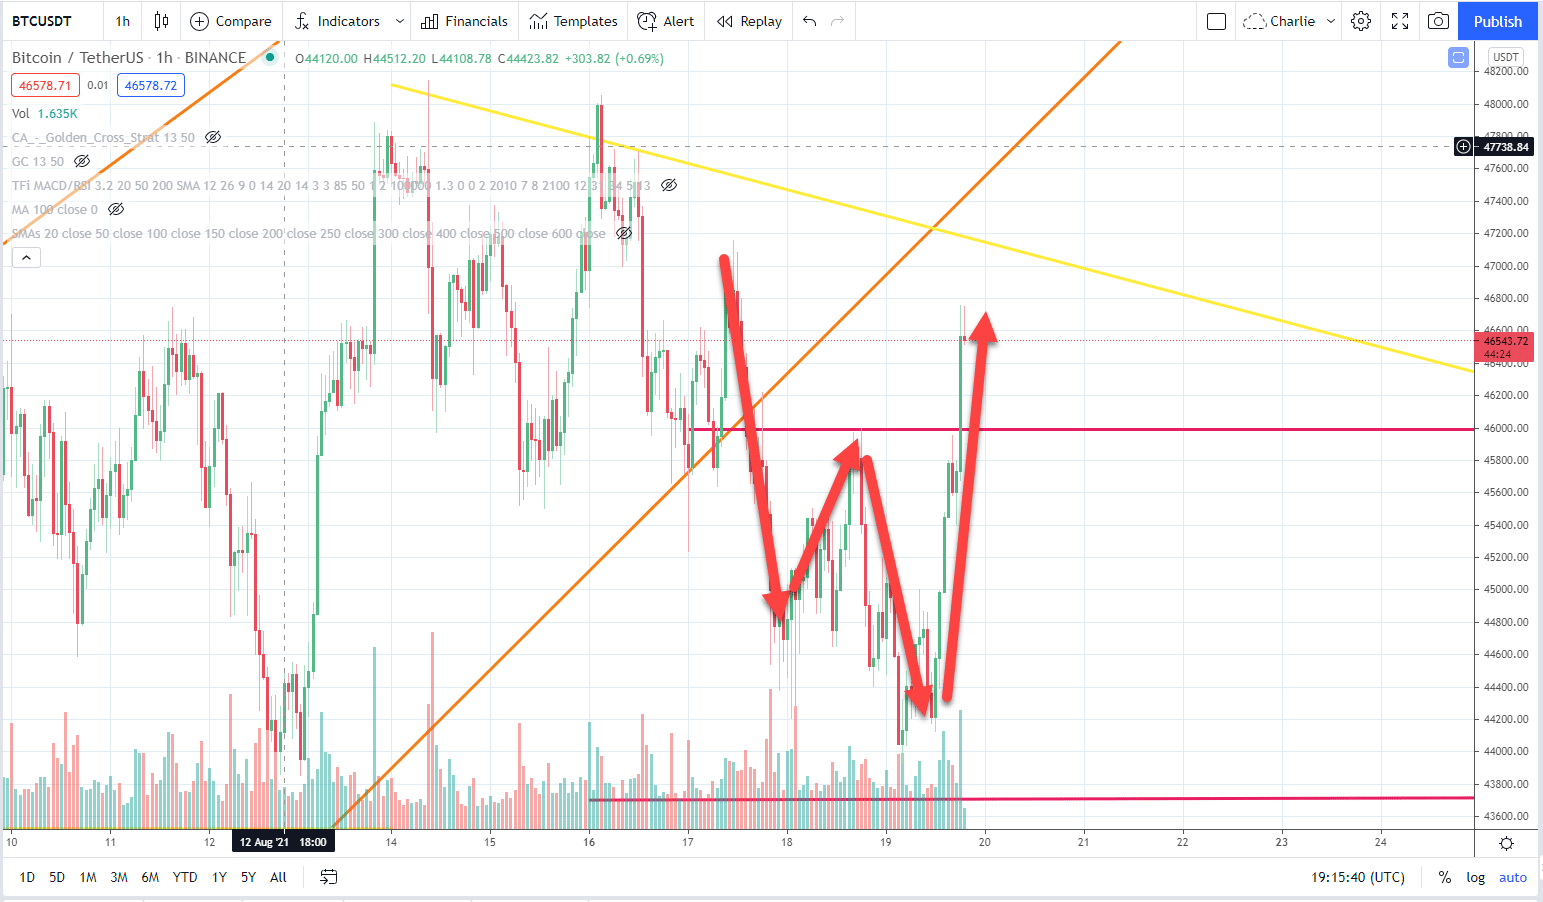
One-Hour Chart Analysis for Bitcoin

Support 2 held strong with several tests heading to $43,8XX. It never quite got there, but several instances were close. The intersection of 12-hour (yellow) trend lines and support trend line (orange) is clearly visible here.

One-hour W formation:
I hate shapes, but cannot ignore this massive W that has been formed on the 1h. Some traders look for these formations to see where the market is headed.
- “W” forming = bullish
- “M” forming = bearish
As you can see, the W has formed and now we look for “leg 1” of the M to be formed. The current one-hour candle is a little red candle with a wick on top and bottom of the candle. Double wicks show indecision by the market as a whole.
4 thoughts on “CTO’s Technical Analysis of Bitcoin: Aug 19, 2021”
Leave a Comment
Subscribe to the Newsletter
Join 7k+ working professionals to "The Five-Year Plan". Every Saturday morning, you'll receive one actionable tip to create life-changing wealth in crypto.
I had chance. It was good me when I read this paper. I agree with you but this current move belong to 4H and not for day trading that you pointed it at the suitable time .I closed all the positions. Thanks guys
When I see Market Index Chart I think market can back to values “0” and then bearish trend again . What do you think? I am eager to know new posts about Market Index Chart .
Glad it could help you with your trading!
Lol now how do you feel since you were wrong and BTC is still rallying after $50k