CTO’s Technical Analysis of Bitcoin: Sept 20, 2021
Note from CTO: World Events
A few blogs back, I mentioned as traders, we need to keep an eye on many factors. One of those factors is world events. Bitcoin is down -8% and the Dow Jones is down -860 points. There are many other factors that were pivotal to this decline. One of them was Evergrande, a Chinese corporation in the property sector. Evergrande is imploding to the tune of $300-350 billion in debt that they cannot pay. The big question everyone is: will the Chinese government bail them out?
These types of events should be watched very closely by diligent traders.
For reference, here are a few links to articles about Evergrande. These are just a starting point. Use your critical thinking skills and discernment to find what resonates with you.
- https://www.cnbc.com/2021/09/20/evergrande-debt-collapse-could-have-domino-effect-on-china-properties.html
- https://www.theguardian.com/world/2021/sep/17/chinas-lehman-brothers-moment-evergrande-crisis-rattles-economy
- https://www.reuters.com/world/china/china-evergrande-shares-plummet-default-risks-2021-09-20/
72-Hour Bitcoin Price Expectations
I am not seeing any love for bulls right now. Both the charts and world events make me nervous. It’s not worth it to scalp a manual trade here or there. All indications are pointing to more bearish price action.
Bitcoin Daily Chart Analysis
Well, BTC had -8% drop today, falling thru Support 1 and holding pretty tightly to Support 2. Price action is a bit below Support 2. Barring any additional bad news, I imagine that price action will hold around Support 2 at $43,8xx.
If the Chinese government does not bail out Evergrande, there could be more downside.
- Indicators are very bearish. The -8% turned all indicators bearish for the time being.
- Indicator X: bearish. (pic 1)
- Indicator Y: bearish. Y in it’s quantum like state is now acting as resistance x4. First, price action has to cross back over Support 2, Daily channel, Support 1 before Y can become resistance! A ways to go! (pic 2)
- BOOM! GC/DC 13/50 has entered into a Death Cross!


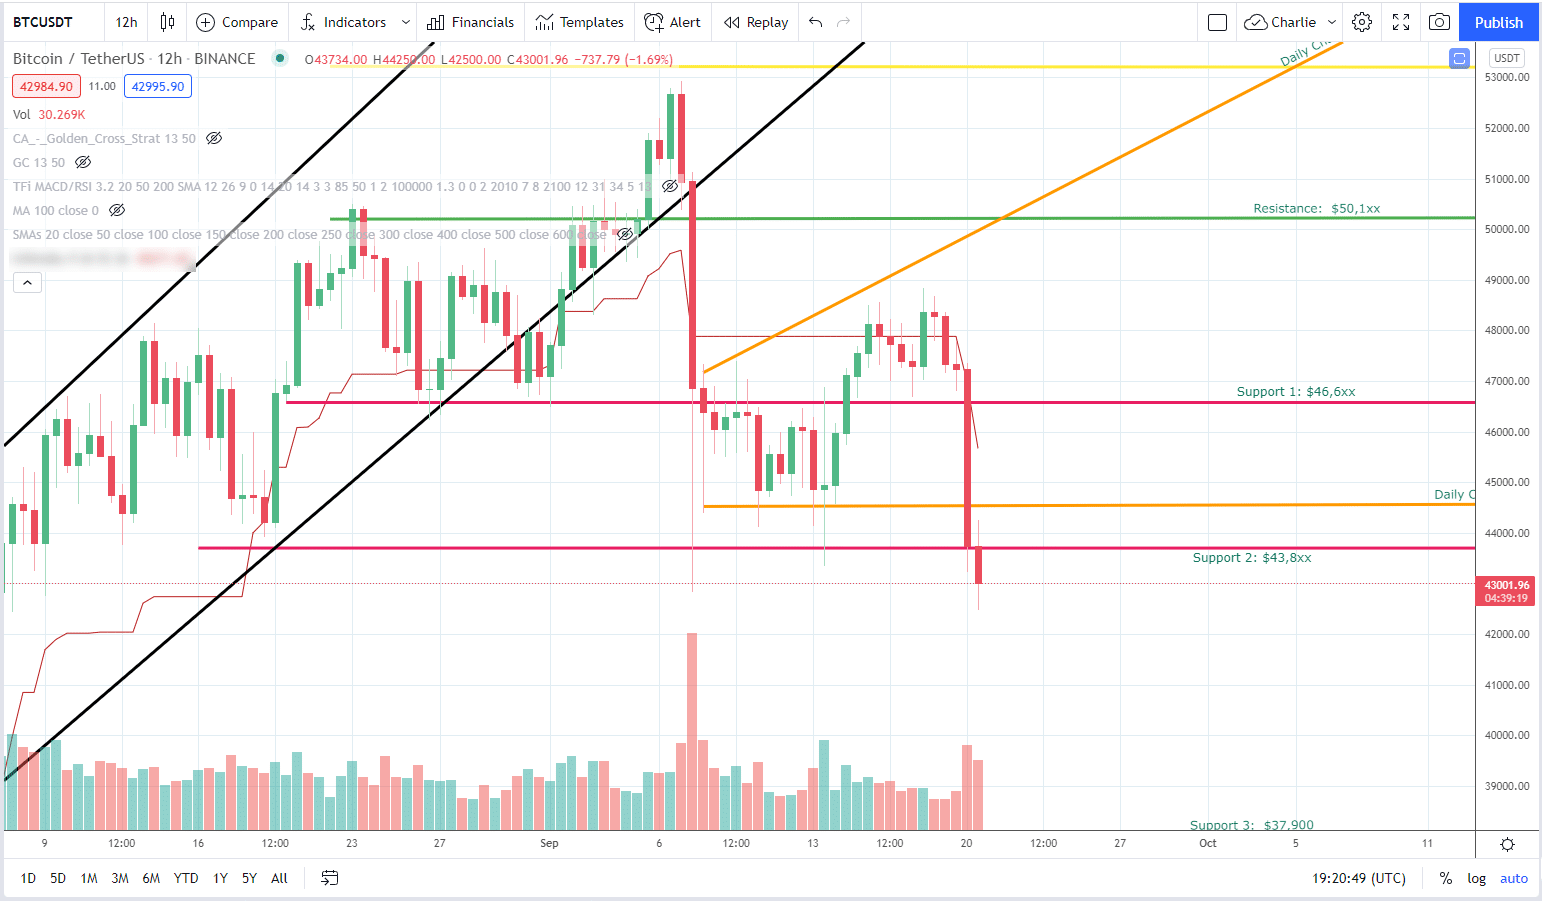
Bitcoin 12-Hour Chart Analysis
The chart gives a closer look at price action and Support 2.
- GC/DC 13/50 is in a Death Cross, with the -8% drop today has expanded the spread between both SMAs.
- Indicators very bearish.
- Indicator X: bearish, approx $2000 below. Price action has a hill to climb to get back above X’s resistance.(pic 2)
- Indicator Y: bearish, nearing the bottom. (pic 1)


Bitcoin 1-Hour Chart Analysis
What an ugly-looking chart! Watching price action fall thru Indicator Y, Support 1, the bottom of daily channel, and Support 2.
One could have sold their position soon as price crossed under Indicator Y’s line ($47,xxx on Sept 19th)!
Combining what we saw on the daily and 12-hour charts, Indicator Y on the 1-hour was a smart play to get out before the big drop!

Subscribe to the Newsletter
Join 7k+ working professionals to "The Five-Year Plan". Every Saturday morning, you'll receive one actionable tip to create life-changing wealth in crypto.