Bitcoin Price Prediction with DIY Machine Learning in Excel
Can you generate your own Bitcoin price prediction with machine learning? Absolutely. Machine learning is more accessible than ever. This article will guide you through a do-it-yourself project, showing you how to trade with your own machine learning models.
For years now, Crypto-ML has been effectively trading using machine learning as its exclusive source of decision making. Now, we’d like to share some methods and insights that will allow you to experiment with this technology on your own.
After all, our mission statement is to level the playing field.
- If you’re not a programmer or data scientist, great! This is a 101-level project. As long as you have some basic Excel skills, you’ll be fine.
- If you are a programmer or data scientist, see this as a way to gain different insights into how the problem of Bitcoin price prediction can be approached.
This project is broken down into 8 steps. There is also some optional introductory info that most people will benefit from.
Introduction
Quick and dirty machine learning project
This project is designed to teach fundamental concepts via a practical project. It will give you the tools needed to potentially create an effective model.
We’ll be able to pull this off with easy-to-use tools.
This project is not designed to explain the complex details involved at each step. However, it will likely enhance your curiosity and inspire you to go deeper in the individual areas that grab your interest.
Can machine learning handle Bitcoin price prediction?
Whether you’re trading Bitcoin, stocks, futures, or forex, machine learning is not only capable of becoming the backbone of your system, it’s ideal.
Consider the information in this image:
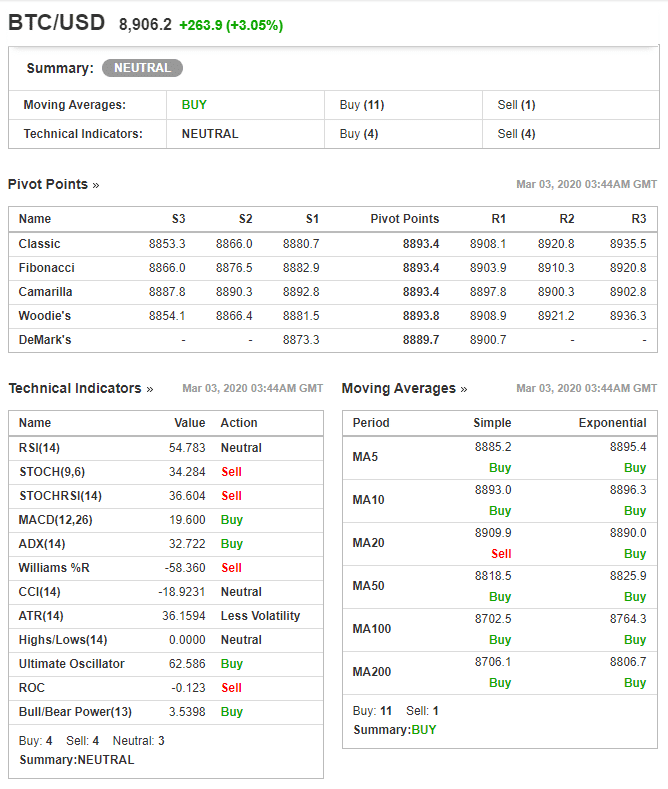
That is a snapshot of technical indicators. But this is too much information for a human to process effectively.
Which indicators do you follow? In what circumstances? What if they conflict? For Stochastics, should you use the default 9 and 6 values, or should you use other values?
There are simply too many combinations for a human.
But this is the perfect problem for machines. Machines process data at rates we can’t really relate to. They can find patterns, optimize parameters, and provide recommendations in milliseconds.
Bitcoin price prediction is exactly the sort of problem machine learning can tackle.
As a case study, Crypto-ML has been generating trades from machine learning and publishing our Trade History publicly since 2018. Here’s how our approach has fared:
What do you need for this Bitcoin price prediction exercise?
Time needed
This exercise should take most people about 1 to 2 hours.
Fair warning: if you make a discovery as a result of this, be prepared to lose weeks as you dig deeper and uncover the possibilities.
Skills needed
This exercise is designed to be accessible. That said, you should have:
- Ability to perform basic tasks in Excel.
- Basic understanding of math and equations.
- Concept of factors that may influence Bitcoin price.
If you have an interest or education in statistics, that’s a great bonus, but not a requirement.
Need a primer on what machine learning is and is not?
This “Machine Learning Guide” podcast does a fantastic job of summarizing machine learning and its place within the data and AI spheres:
Tools needed
To build your own Bitcoin price prediction machine learning model following this tutorial, you’ll need:
- Microsoft Excel. While they probably work, we have not tested for workarounds in Google Sheets, LibreOffice, and others.
- A BigML.com free account. You can sign up for free at bigml.com.
- A data set. You can download our basic set and layer in any additional data points you want. The dataset is available lower in the Collect Bitcoin historical data section of this article.
That’s it!
At the end of this post, we’ll talk about different ways you can take this further. But for now, that’s all you need.
Does Excel really work for machine learning?
Excel has become quite capable of handling sufficiently large data sets.
Excel is easy and visual. It can be great for exploring data and sharing ideas with those who aren’t savvy in more complex tools. If you make a breakthrough following this exercise, you may want to get together with friends and improve upon it. Excel is an excellent platform for this.
It’s also quite effective at handling the sort of math we’ll need.
Lastly, not only will you use Excel to create your data set, but your machine learning model will also be output as an Excel spreadsheet.
That is, BigML will output a complex Excel spreadsheet that will generate Bitcoin price predictions based on new inputs.
If you pursue data science and machine learning further, you will eventually grow beyond Excel. Languages and frameworks like Python, TensorFlow, R, and SPSS can provide more flexibility and better handle very large datasets.
What is BigML?
In addition to Excel, we’ll use a free tool called BigML. It is a comprehensive suite of cloud-based machine learning tools and frameworks.
Having BigML at your disposal means you don’t need to be software developer to work with machine learning. It also means you don’t need high-end hardware to run machine learning algorithms.
BigML puts machine learning in the hands of everyone. We’re fortunate to have a tool like this available.
Machine learning definitions
Before diving in, we’ll provide basic definitions that will help avoid confusion.
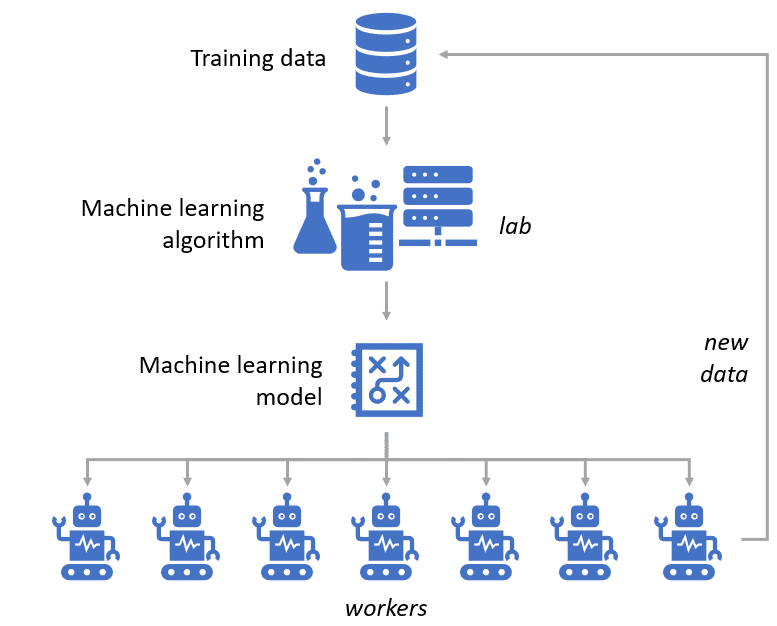
1. Training data
Your training data is a large set of data you supply to a machine learning algorithm. This data will train a model to achieve a specific goal.
For example, Tesla has collected data on millions of miles of driving. This data set is used to train Auto Pilot.
To improve, each Tesla vehicle (worker) on the road uploads its data back to central datacenters (lab) so that new data can continuously be supplied and the lab can find ways to improve self-driving.
2. Machine learning algorithm
Once you have a fantastic data set, you need to feed it to a machine learning algorithm. This is what happens in the lab. It is the part of the process that is slow and requires experimentation.
Algorithms are often confused with models. The algorithm is used to create a model. Algorithms are the learning portion of machine learning.
For example, Tesla uses algorithms to process data and come up with a model for its cars to use. Again, algorithms are run in labs. When they have a great result, that output (model) gets deployed to the field so the workers know how to behave.
There are many, many machine learning algorithms (extensive list – Pathmind.com). This post will focus on Decision Trees.
3. Machine learning model
A model is the output of the algorithm. Once the algorithm has learned how to optimally achieve your goal, it will generate a model. You now have something you can give to your workers.
When the workers encounter a new situation, they’ll consult the model and make a decision, which is really a prediction of what the best action is.
Said another way, the lab sends a new method of decision making to the workers.
If you did a great job in the lab, you have a highly efficient model. This means your worker can take in new data and respond to it immediately.
For example, once Tesla finds a way to improve Auto Pilot via a machine learning algorithm, those lab scientists have a new model. This model will then be sent via a software update to all Tesla vehicles on the road. Now, each Tesla vehicle will follow this model in real-time in order to navigate roads. As the vehicles take input through sensors, that input is processed by the model and a decision is made to turn, slow down, speed up, etc…
Algorithms learn. Models predict.
4. Bitcoin price prediction machine learning
With that basis covered, let’s also define what we’re trying to accomplish in the exercise. We want to:
- Collect data and create an excellent set of Training Data.
- Give that data to an appropriate Machine Learning Algorithm so that it can create a prediction model.
- Use the resulting Machine Learning Model to predict future Bitcoin price action.
To illustrate, here’s how these components come together to work for Crypto-ML:
That’s it! Let’s get going…
See machine learning in action
Do you want a great sample of how machine learning works?
- If not, skip this section.
- If so, we’ll refer you off for a quick run of Google’s Teachable Machine.
A fast, easy way to create machine learning models for your sites, apps, and more – no expertise or coding required.
Google’s Teachable Machine
Teachable Machine is designed to teach the concepts of machine learning. It walks you through three phases:
- Gather samples
- Train your model
- Export your model
You can watch the 3 tutorials right here in about four minutes. Once done, you can try to create your own model on their site.
Step 1: Gather samples
Step 2: Train your model
Step 3: Export your Model
We recommend trying the image project. You simply turn on your webcam and show your computer two different things. For example, you can show your computer:
- Your left hand up
- Your right hand up
After the system collects enough samples of each hand up, you will have trained a machine learning model.
You can then run the model, turn your webcam on, and raise a hand. Your model will tell you which hand you’re raising. It will give you the answer and also a confidence level.
Pretty cool, right?
Now you have the basic principles. But how can this help you predict Bitcoin price? Let’s find out next.
Part 1: Define your question
The first step is to define the question you want help with. You may say you want a Bitcoin price prediction, but that is not specific enough.
Machine learning needs an objective. It needs a goal. It will take an endless amount of data, search it for patterns, and try to predict results based off of those patterns. It will continue to refine its approach, getting better and better at predicting the objective you have set. But if you don’t set a great objective, you won’t get great results.
To get what you want out of a computer, you need to be crystal clear.
Speak in terms of variances and percentages
One of the biggest mistakes people make when applying machine learning to market and Bitcoin problems is they use raw data and absolute numbers.
The better solution is to use variances and percentages. For example, instead of asking:
What will the price of Bitcoin be tomorrow?
We should ask:
By what percent will Bitcoin price change tomorrow?
This is a subtle but critical difference. Throughout this entire exercise, we will transform most data points to variances so that we can speak in terms of change instead of absolutes.
What do you really want to know?
Alright, now that you know your question should be asked as a variance, let’s drill down to the next level of detail.
Everyone has a unique objective for their finances. Are you a Bitcoin trader or investor? What is your time horizon?
Really think about the “one thing” you’d like a computer to answer for you.
Caution: timeframes matter.
Take a look at Crypto-ML Trade History. You’ll see each coin has its own trade frequency. You can see how that has evolved over time. In general, we want our trades to fall in a swing-trading mode rather than fast day trading, scalping, or even long-term investing. We want our models to optimize within our acceptable swing-trading range.
Let’s take a look at some practical considerations. Since Bitcoin hasn’t been around that long, it does not work well to ask:
How much will Bitcoin rise or fall next year?
The problem is Bitcoin has been active for about 10 years. That’s really only 10 periods for our learning to consider. We want a lot of data points to consider. In fact, you can be assured the more data you have to consider, the better your model will be.
Stick to tighter timeframes that are relevant to your particular trading style.
By what percentage will Bitcoin change in 6 hours?
Now that’s a specific Bitcoin price prediction question that a machine can answer!
Action: write down your specific, measurable, variance-based question.
Part 2: Define your answer
Now that you have a great question, it’s time to structure your answer. How will you mathematically answer your question?
In machine learning, you use an algorithm to train and create a model. To do this, you will supply the algorithm with a bunch of data. You also need to give it the answers. By having the answers, it can look at the data and figure out a way to consistently arrive at those answers based on the data given.
Imagine a table full of data. Each row has a set of inputs (aka characteristics). At the end of each row, you have the answers (aka goal). With this, the algorithm can work through the data and figure out how to determine what each row is.
- Question: what time of animal is this?
- Answer: type of animal.
Training rows:
| Body | Legs | Movement | Weight | Sound | Answer |
| Fur | 4 | Walk | 60 | Woof | Dog |
| Scales | 0 | Swim | 0.05 | Glub | Fish |
| Fur | 4 | Walk | 12 | Meow | Cat |
| Feathers | 2 | Fly | 1 | Cheep | Bird |
| Fur | 4 | Walk | 36 | Woof | Dog |
In this example, you can see we have supplied five characteristics and the goal. Based on this, we want a model that can consider a new row of characteristics and then give us an answer to the question: what type of animal is this?
Question row:
| Body | Legs | Movement | Weight | Sound | Answer |
| Fur | 4 | Walk | 43 | Woof | ??? |
This example illustrates the importance of knowing your question, the answers you’re looking for, and the characteristics that may apply.
Coming back to Bitcoin price prediction, let’s look at this question:
By what percentage will Bitcoin change in 24 hours?
How should we mathematically express the answer? Will it be a simple percent change?
( Current Price - 24 Hour Old Price ) / 24-Hour Old Price
This will be a great approach. Your result will be a continuous number (Wikipedia). That is, you may receive a value that is -8.05%, 0%, 1%, 4.54%, -0.04%, or any in between.
An alternate approach: categories
This will undoubtedly be controversial, but where we have found success is in taking a snapshot of the market at a given time and asking the algorithm to categorize each snapshot.
Does this snapshot of the market look like it does before a big jump or big drop?
As noted above, machine learning can be used to predict specific values, such as the price of a house (i.e. “continuous” values). But it can also be used to categorize things, such as “this is a dog, that is a fish.”
What if we could have a machine learning model give us one of three outputs?
In 24 hours:
- Price will go up by 5% or more Category A (bullish)
- Price will stay between +4.99% and -4.99 Category B (neutral)
- Price will go down by 5% or more Category C (bearish)
As a trader, this is great information to know. We could even establish a trading system based on this. For example, if the model predicts a Category A, then we could open a trade.
Machine learning flexibility
The beauty of this is you have the freedom to define your question and your answers in a way that suits your trading style.
You can use a different timeframe than 24 hours. You can have a continuous goal or categorical goal. If categorical, you can use the three category examples above, or create five of your own categories.
The human factor in this a still huge. This means with common sense and experience, you may be able to create a machine learning model that vastly outperforms what ML pros create.
Action: write down your answer either as an equation or categorical expression.
PS- Want to see how we approached the question and answer steps for our Release 4 models? We wanted our solution to find anomalies in the market, which we describe here: Bitcoin Trading with Machine Learning Anomaly Detection.
Part 3: Collect Bitcoin historical data
To learn something, you need input. Data is what machines consume to learn. Just like humans use experience to learn, we want to expose our machine to as many scenarios as possible. The more data points available, the better it’ll be able to make a Bitcoin price prediction.
Great Bitcoin historical data sources
Your first stop will be basic price data. Here are a few great sources:
Crypto-ML Sample Data
To make things easy, you can use our sample dataset. It is not kept current, but it’ll get you through this exercise. It includes over 22,000 rows of hourly OHLCV data.
Download Crypto-ML Bitcoin Historical Dataset
With this data, your model should be able to identify the equivalent of chart patterns, candlestick patterns, and calculation patterns. Your model can potentially become the ultimate technician.
Crypto Data Download
Crypto Data Download is one of the best sources of data for machine learning. Bitcoin historical data is completely free and does not even require registration. They describe how and where they get their data. Better yet, you can choose data from many global exchanges.
The last point is important because if you operationalize your trading system, you want your “live” data to come from the same source you used to train your model.
Back Test Market
BackTestMarket.com offers inexpensive sets of data, including 1-minute sets. Data sets typically include date, price, and volume data (OHLCV).
Investabit
Whereas Back Test Market offers just historical data, Investabit provides both historical data and a streaming API so that you can continue to feed your machine.
Data sets are very robust and include date, price, volume (OHLCV), tick, order books, and much more. This is a true professional-grade site for machine learning projects.
Cryptofinance.ai
Cryptofinance has both free and paid options, with current and historical data available. Better yet, they have made it accessible by providing a simple Google Sheets integration. They will also be releasing data from technical indicators, which may be useful for training your models as well.
Big data at your disposal
While a human will short out considering all of the potential combinations in the simple datasets mentioned above, a machine can handle much, much more.
Curious about social media impact? Go grab Twitter and Google data.
Think economic factors might cause price changes? Find interest rate, commoditiy, and stock market data.
So much data is readily available. Take that as an opportunity to test hypotheses and craft a fantastic model.
Part 4: Structure your data
If you open your raw data, it probably looks something like this:

Common mistake: most tutorials take basic data like this and pipe it into a machine learning algorithm, expecting a miracle.
Using raw data will not work. Let’s take a look at how we can take this raw data and start expressing concepts that a human might consider within it.
Format data as a table
As a first step, make life easier for yourself. By formatting your data as a table, you can simply enter an equation once, and it will automatically generate that equation down the entire column. If you’re working with thousands or millions of rows, this is a lifesaver.
Additionally, you’ll be able to refer to different cells in the same row by using the column name. Simple.
To format as a table, click on the Home tab and then Format as Table.
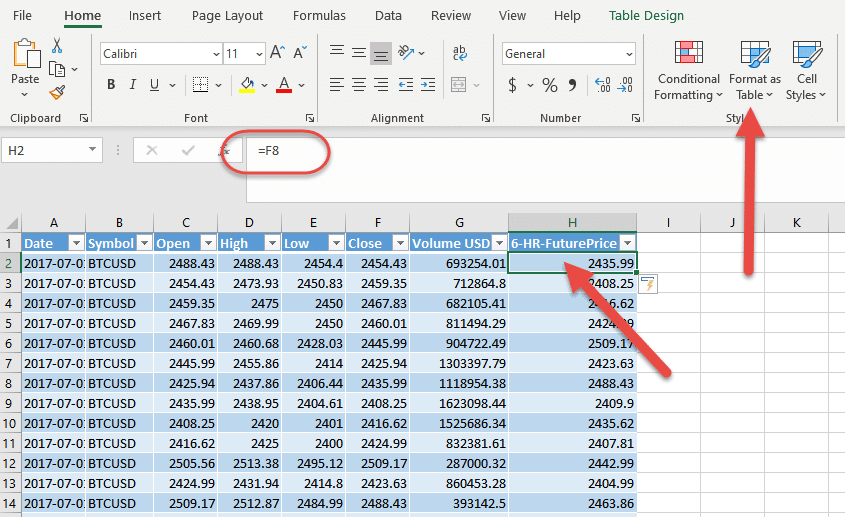
You’ll notice we’ve entered the first equation. Columns A through G are raw data. But in cell H1, we’ve entered:
=F8
This shows Close 6 hours from now. That sounds like something we’d like to predict!
By entering one equation, you can see the beauty of formatting as a table. You just have to enter the equation once and it will repeat across the entire column.
Now that we have our base set of data, let’s start “describing” it in a way that will be interesting to a machine.
Start with moving averages
When we want a price prediction, we will input a row of new data. Since we don’t want the model to consider that row in isolation, we want to give some information on historical context.
A great way to do that is to give the average of previous periods. That is, instead of just saying “price is $8,000,” we want to say “price is $8,000 now, which is up 5% compared to the last 10 hours.”
Moving averages are the foundation of most technical analysis. They are giving you information on how price and other factors are changing over time.
So let’s create some new columns and enter a few moving average equations.
In a new SMA10 column, go to cell 12 and type:
=AVERAGE(F2:F11)
That assumes the Close is in column F. You are calculating the average of the previous 10 Close values in column F. This equation should then populate down your entire column, adjusting automatically one row at a time, making it a “moving” average.
You can also calculate averages for fields other than Close.
In this screenshot, you can see a 10-period moving average of Volume:
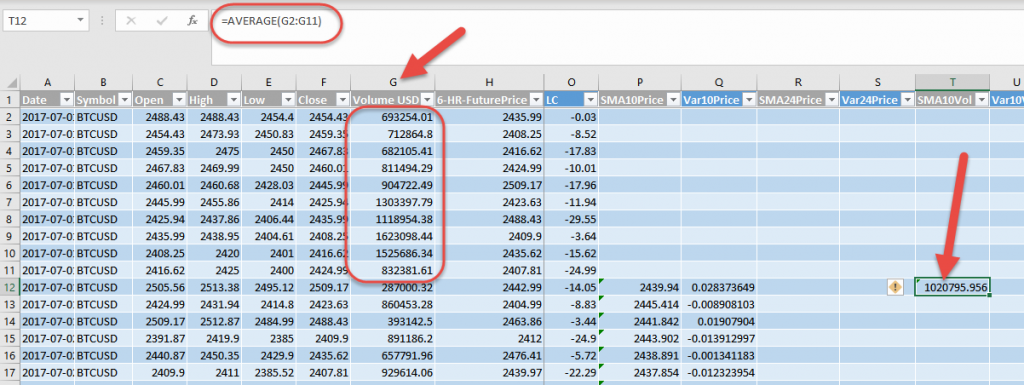
Now, our dataset will provide information on how both price and volume are changing.
Common timeframes you might consider adding are 5, 10, 20, 50, 100, and 200-period. The beauty of machine learning is you can give it as many data points as you want. Give it as much as you can and then let it decide which help it make accurate Bitcoin price predictions.
Machine learning likes percentages
Earlier in this article, we discussed speaking in variances. Now it’s time to put that into practice.
For most calculations you do, such as a moving average, you should take that calculated value and turn it into a percentage change. This way, when the algorithms are analyzing your dataset, they can see how much each row is changing (the variance) regardless of how big or small the raw values are.
Why are percentages so important?
- When Bitcoin was $1,000, a jump of $200 was a 20% gain. That’s huge.
- When Bitcoin was $10,000, a jump of $200 was a 2% gain. That’s less interesting.
This means the significance of $200 changes over time. Because of this, it’s not good to train your model on absolute values. The effectiveness of your model will reduce quickly as the market changes.
Percent change is calculated as (New – Old) / Old. As an example:
=([@[Volume USD]]-[@SMA10Vol])/[@SMA10Vol]
This tells us how much Volume has changed compared to the last 10 periods. In the picture here, it says Volume is down by 71.885%.
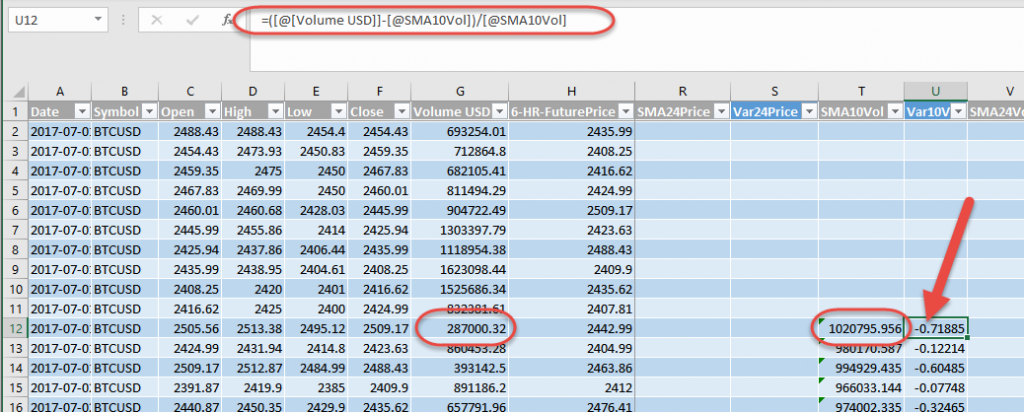
Now, your job is to build out as many equations as you think may be useful. And for each equation, create a corresponding percent change. This will tell us how different the new row is from various historical perspectives.
In this screenshot, we’ve started adding a few moving averages for Price and Volume. Each has a percent change.

Candlestick data
Now that you’ve created a few moving averages for the algorithms to learn from, we can add in another easy set of calculations.
Candlestick patterns are regularly used to analyze the markets, so let’s include them and see let machine learning see what it thinks.
Bonus tip: To calculate candlesticks, simply create a few equations that calculate the differences between the various combinations of Open, High, Low, and Close. Again, you should use percentages instead of raw numbers.
Sample calculations:
=([@Open]-[@High])/[@High]
=([@Open]-[@Low])/[@Low]
=([@Open]-[@Close])/[@Close]
=([@High]-[@Low])/[@Low]
=([@High]-[@Close])/[@Close]
=([@Low]-[@Close]/[@Close]

Do you think it matters how candlestick data changes over time? If so, you can create moving averages from each of these as well.
Track variances and other important inputs
Since we generally don’t want the machine learning algorithms to consider raw data as they learn, we recommend noting your calculated columns for easy reference later. As you can imagine, you’ll potentially end up with many dozens of columns. This step will help you keep track.
Marking the ones that matter in either color or specific naming convention will be very helpful later in the process.

In this screenshot, we’ve grayed out the raw-data headers and marked our variances in blue. The blue columns will be fed to the machine.
Day and time handling
There are likely certain times of day and week on which big changes happen. For example, perhaps institutional traders in the United States tend to log in Monday morning at a certain hour, see what’s happening, and move a bunch of money.
Likewise, there may be certain times of the month that are tied to unusual activity, such as near options expiration.
Fortunately, Excel makes it easy to pull out date-based data. You can create a few new columns:
Month =MONTH([@Date])
DayofMonth =DAY([@Date])
DayofWeek =WEEKDAY([@Date])
Month =HOUR([@Date])

We won’t need variances for these values, but there will be a couple of different ways we can handle them in BigML when we get to that step.
Technical analysis
What if you could feed your machine learning model all of the data points you see coming out of traditional technical analysis?
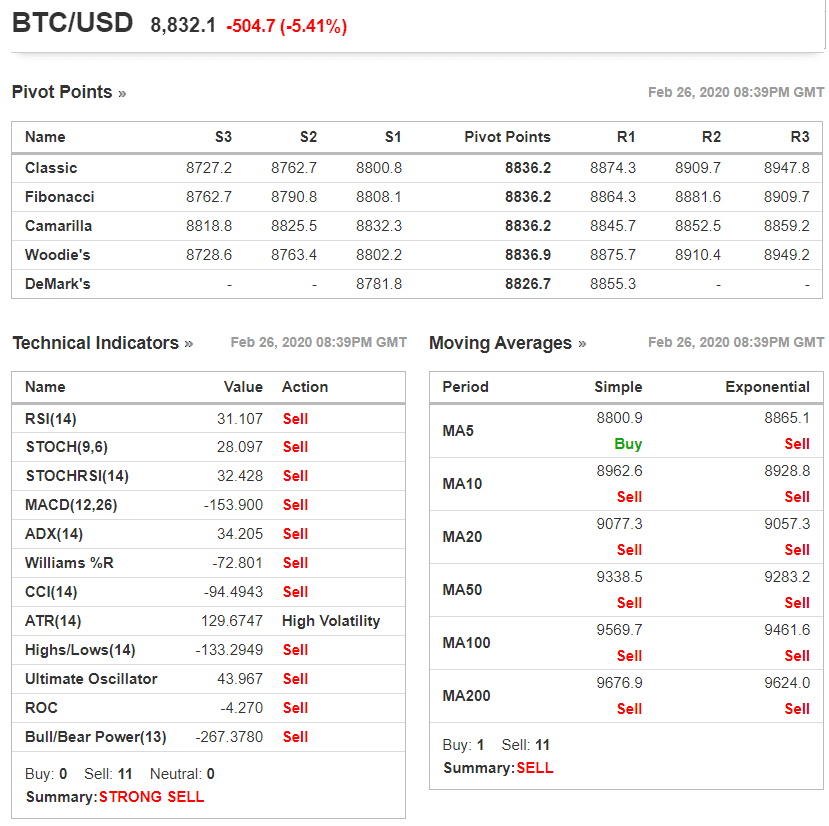
Like candlesticks, technical indicators are nothing but numbers and math. This is good news because we can calculate these values in Excel and feed the results to machine learning algorithms. With this, machine learning can determine when, if, and how much to pay attention to a certain technical indicator.
If you’d like to add indicators, there are some outstanding tutorials here:
- Technical Analysis in Excel: Part I – SMA, EMA, Bollinger Bands
- Technical Analysis in Excel: Part II – MACD and RSI
Additionally, Tulip Indicators provides calculation steps for 104+ technical indicators. The base math is given so you may need to do some work to get these going in Excel. However, they also provide an Excel Add-In.
Caution: calculating technical indicators can get complicated quickly. If this section is confusing, please skip ahead. You already have a great dataset without these.
Here is an example of how we might calculate a dynamic MACD (Moving Average Convergence Divergence):
EMA1: =[@Price]2/(1+Variables!$B$2)+@INDEX(Data,ROW()-2,4)(1-2/(1+Variables!$B$2))
EMA2: =[@Price]2/(1+Variables!$B$3)+@INDEX(Data,ROW()-2,5)(1-2/(1+Variables!$B$3))
MACD: =[@EMA1]-[@EMA2]

This example assumes you have a different sheet Variables with values for the moving averages.
Why might you use variables for the parameters? Traditionally, MACD measures a 12-period EMA against a 26-period EMA. But are those the optimal values? By replacing hard values with variables, things get complicated, but you can really let machine learning go wild.
As you get into technical indicators, you may need to start learning a few Excel functions. Our MACD calculations use the Index function, which is useful in most technical indicators equations. It is described in this tutorial:
Calculate your answer (goal)
By this point, you should have a spreadsheet full of interesting data for a machine learning algorithm to consider. But before we feed these rows in, we need to identify what the prediction of each row should be.
That is the goal. That is the “type of animal” we’re describing with all of the other data in the row.
Assuming we want to predict a change in future price, let’s look at how we can do that.
Create two new columns:
- 24-HR-FuturePrice
- GOAL
For 24-HR-FuturePrice, simply choose the Close value 24 periods in the future.
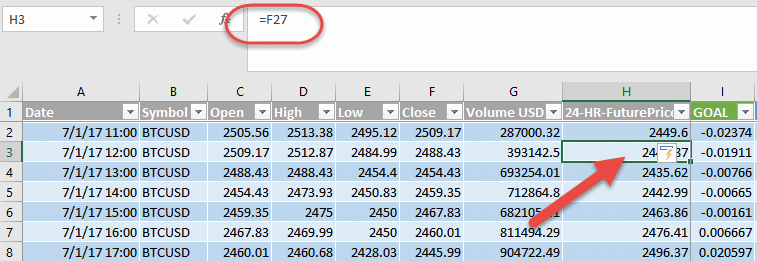
For the GOAL column, we simply calculate the percent difference between the future price and current price:
=([@[24-HR-Future-Price]]-[@Close])/[@Close]

Now we have the value we want our machine learning model to predict.
If the GOAL field says 5%, that means after the current market conditions, price went up by 5%. It’ll be up to the machine learning algorithm to see if there is a pattern in the data we supplied that can help predict that 5% value.
Vary your Bitcoin price prediction goals
It’s time to go back to the question you wrote down in Part #1: Define Your Question.
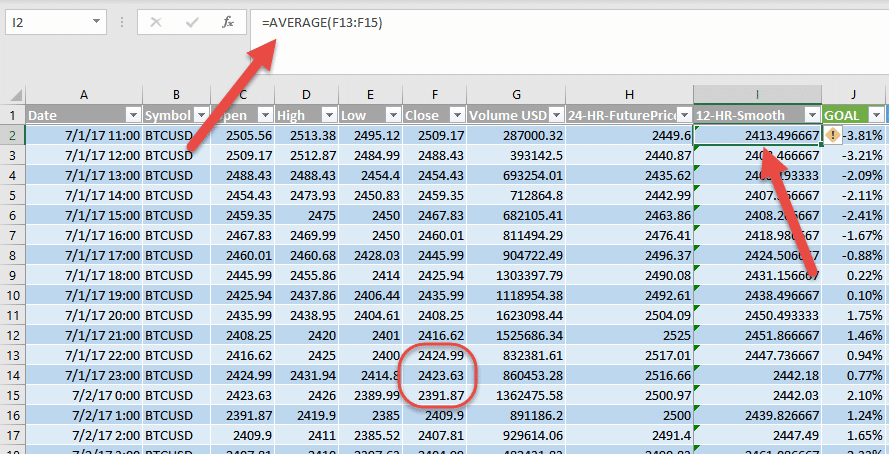
Maybe instead of wanting to know the price change 24 hours from now, you want to know the price change 12 hours from now. Maybe you also want to avoid noise and false flags, so you smooth out your data by taking a 3-period average of price 11, 12, and 13 hours from now. Here’s an example of that:
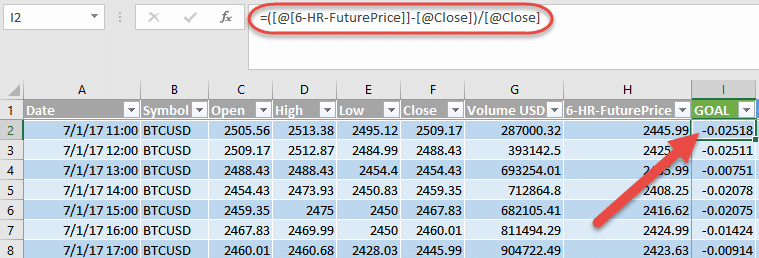
Here’s an even tighter example, looking six hours into the future:
This is meant to show there are many possibilities for tackling the problem of Bitcoin price prediction. Your inputs can vary. Your goals can vary.
Expert tip: should your goal be defined as “Future 1 hour minus current” or “SMA3 of Future 24 hours minus SMA3 of current” or some other construct? Machine learning will help you here, too. Let a machine help define your optimal goal. This topic is too complex for this article, but COIN-OR provides outstanding optimization algorithms that will help you solve these types of problems.
You can experiment and tinker endlessly. Along the way, you’ll uncover amazing insights and clues that will massively improve your understanding of the markets and approaches to improve your trading. For now, go with the goal you initially defined and let’s see what it nets.
Save your dataset for upload
Once you’re happy with your data, save a different copy for upload to BigML. We’ll do this to strip out the equations and Excel overhead, leaving only what matters.
In Excel, simply choose Save As and select CSV as your file type.
Part 5: Upload your data to BigML
You now have a data set that will be used to train a machine learning model. Once the model is trained and you confirm it is effective, you can use it to begin giving you predictions.
In BigML, head to your Dashboard, click Sources, and then the upload button on the top right.

Once it finishes processing, click the Configure Dataset button on the top right. This will convert the raw data you uploaded into the specific dataset you’ll feed to the machine learning algorithm.
Before hitting the Create Dataset button, go through and uncheck any columns you don’t want the algorithm to consider.
Caution: we want the machine learning models to consider variances not raw values. Uncheck unnecessary data points.
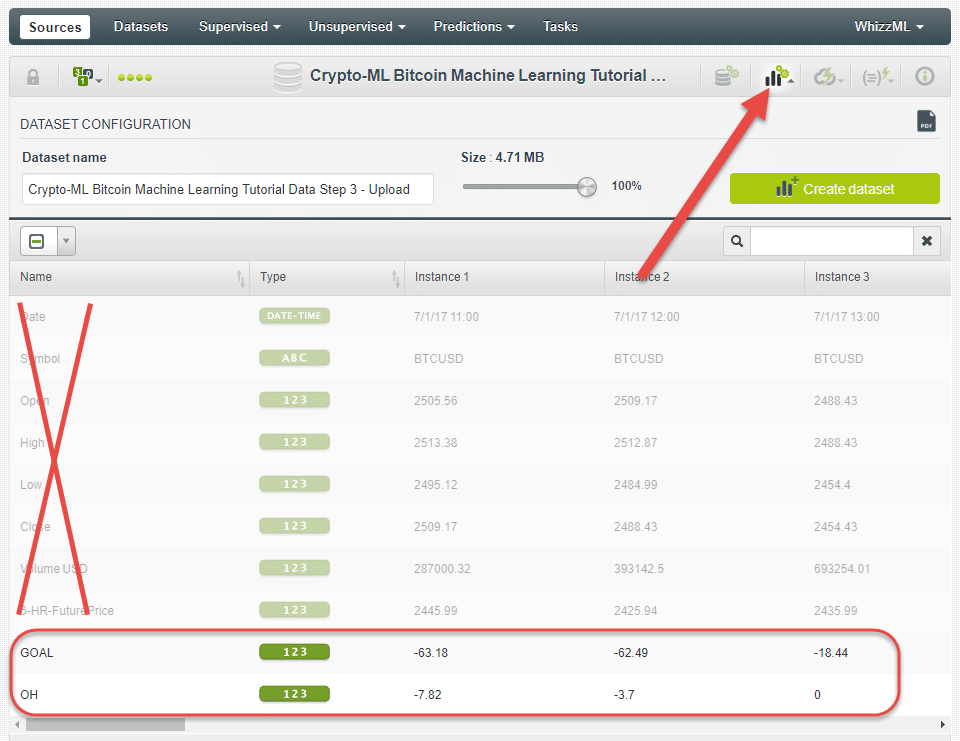
As you can see in the screenshot above, the fields we don’t need have been deselected. Be sure to leave the GOAL.
You may have pages of data points to go through and review:
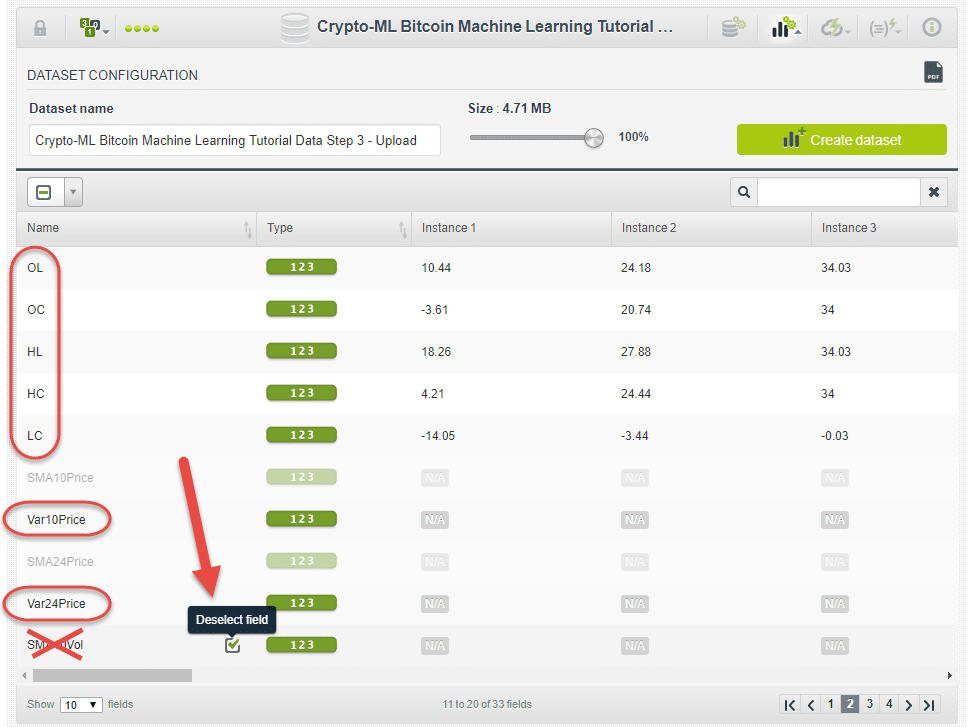
Once you’ve gone through each column and reviewed for inclusions, click the Create Dataset button.
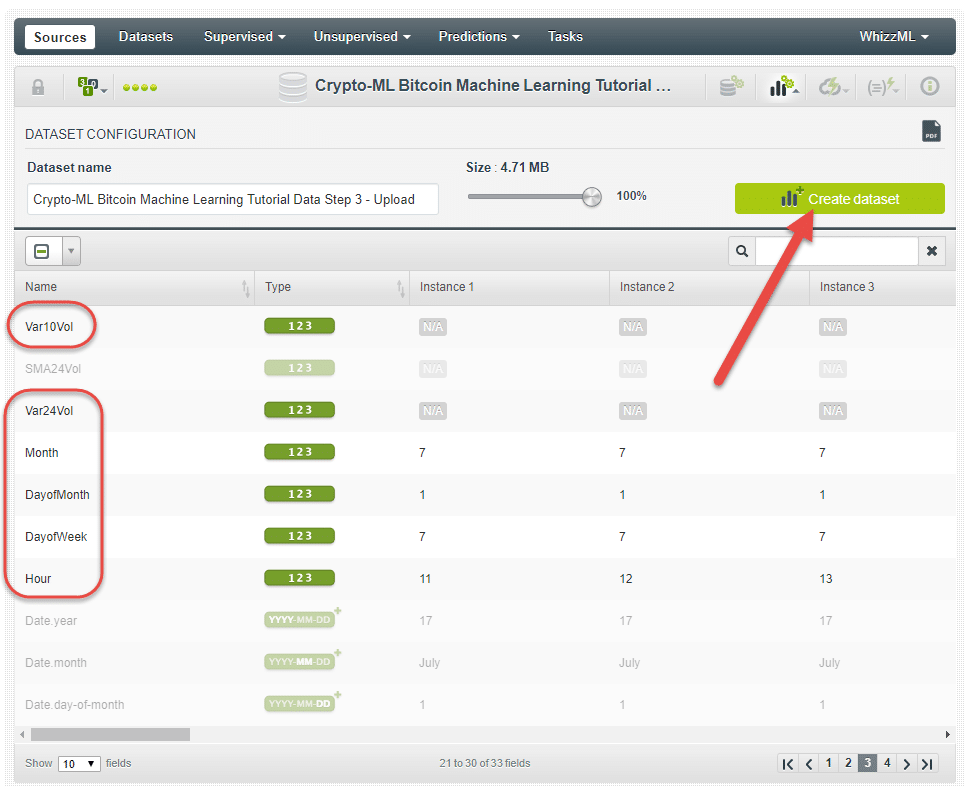
Bonus tip: in the Type column, you can see a green 123 next to each item. This means your data points are being considered as continuous numbers. If you instead have categorical data, be sure to click and change it.
Clean and correct your data
This seems self-explanatory, but bad data equals bad results. BigML provides some tools to help you check your data quality.
Now that you have a dataset in BigML, you can do quite a bit of validation. In fact, data validation is an entire field of study. For now, let’s look at some basics.
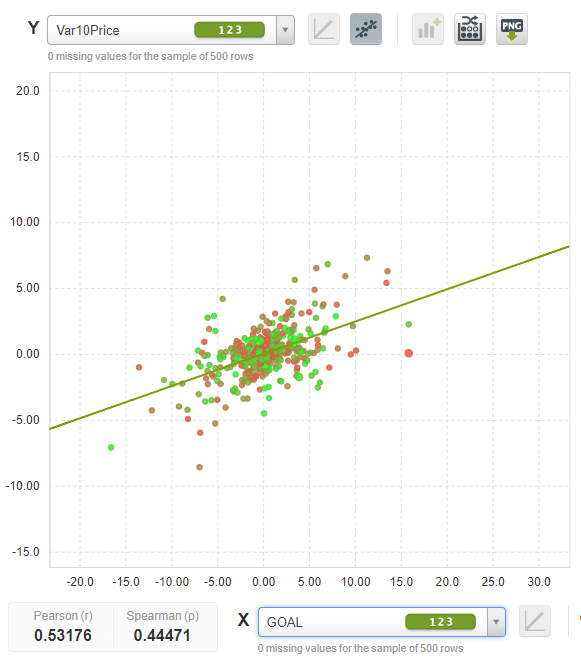
On the top left, click on the Scatterplot button (the icon of a bunch of dots going up and to the right). Try flipping through your different inputs against your output.
If you have a small set of values far outside of the others, you may have a problem in your data. Hovering over the data point will give you additional detail. You can then go back into your spreadsheet, find the issue, and troubleshoot from there.

This issue shown above occurred because our moving averages were calculating into the future where no data was. The same thing happens for moving averages looking into the past. It’s better to have a blank or remove these rows entirely.
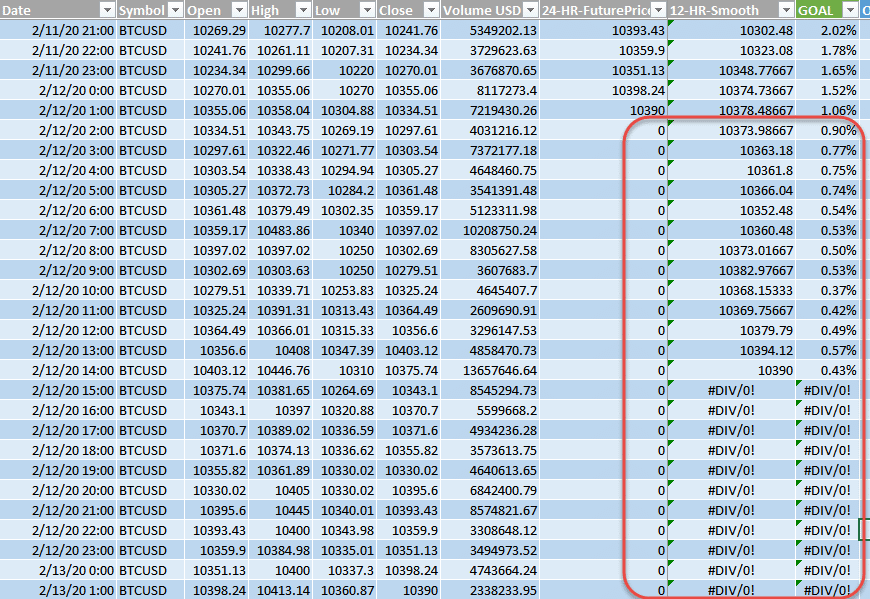
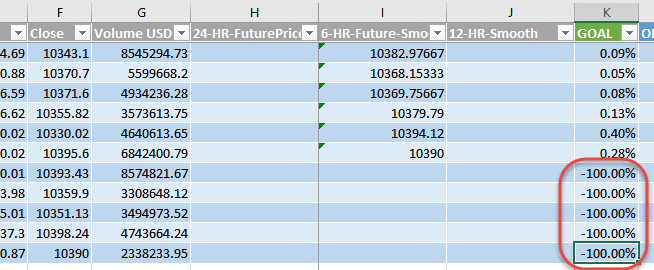
Here’s another issue where missing values resulted in an extreme calculation. This data should not be considered by the machine learning algorithms.
Once we removed the problems from our data set, the scatterplots looked much cleaner. Visually, you can see what looks like a trend, which is a good sign.
Here are a few extra tips for finding issues in Excel:
- Look for missing values: In a column, hit CRTL ↓ (Control and the Down Arrow). This should jump you to the bottom of your column. If not, it likely found a break in your data. Missing data is okay, just ensure it isn’t skewing other calculations like variances and averages.
- Look for extreme values: Select an entire column and look at the summary data on the bottom right of your screen. It can show you Max, Min, Average, and more. Are the numbers in the right range?

Splitting your source for testing
You may have noticed that when you create a dataset, BigML has options for splitting your source into two different sets:
- A training set, which is typically a random 80% of your data.
- An evaluation set, which is typically a random 20% of your data.
Doing this will give you a much better idea of how your model will perform in the real world. By splitting out your data, you can train your model on one set of information and then see how it performs against a set of data it has never seen before.
You’re welcome to experiment with this feature, but breaking out your data can be automated using the OptiML feature, which we’ll discuss below.
Part 6: Train your model in BigML
As it turns out, the hardest work is in the prep. We’re finally ready for the exciting part!
Let’s see what machine learning algorithms can do with our data.
For our first go, let’s create a Model in BigML. This will create a Decision Tree model. Decision Trees are one of the most efficient, effective, and understandable models. They suit our purpose well.
From your Dataset screen, click on the Configure button and choose Model.
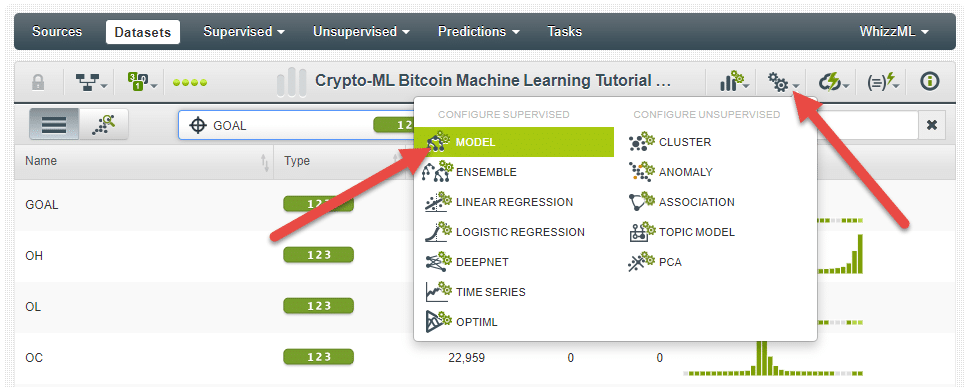
Bonus tip: The BigML “Model” selection is the only one that can export an actionable machine learning model to Excel. However, if you’re a programmer, you can explore the more advanced model types. Crypto-ML primarily uses Deepnet equivalents.
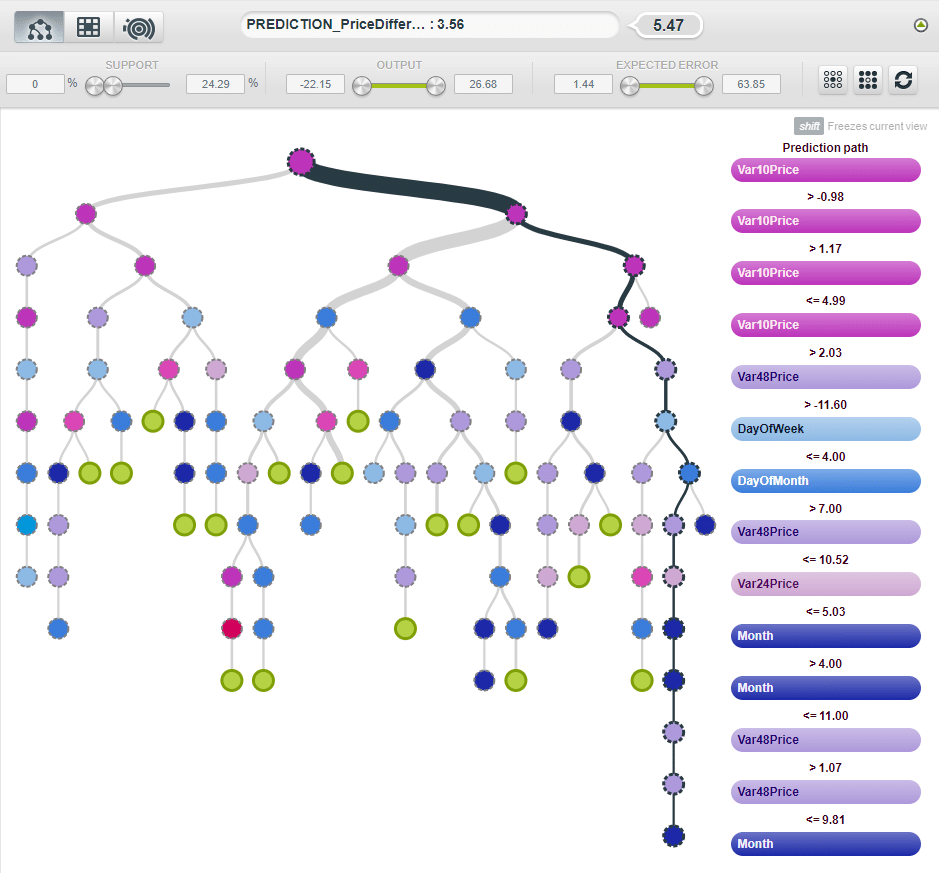
After BigML processes for a bit, you will be presented with a screen that shows your Decision Tree. At the end of each branch, you’ll see a Prediction. That is, you’ll see the answer to your question.

You can follow each branch down to see how the model evaluated your inputs and arrived at a prediction. Most models cannot show you how they make a determination, but Decision Trees can.
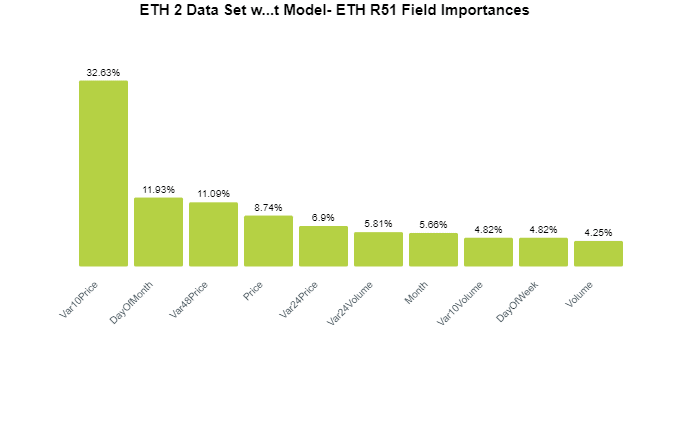
You can also click on the Model Summary Report button to see what factors are most important. This is key, because you may be performing some complex calculations or sourcing hard-to-find data. You want to know if it’s worth the effort. Maybe certain “hard to get” data has almost no impact on the prediction. If that’s the case, drop it and have a more efficient model.
Here’s a Model Summary Report example. You can see it is heavily weighting the Var10Price, which is a 10-period moving average variance. The second most important is DayOfMonth.
Here’s another example. Based on a different goal, the algorithm has constructed a model that puts a lot of weight behind Open – Close (OC).
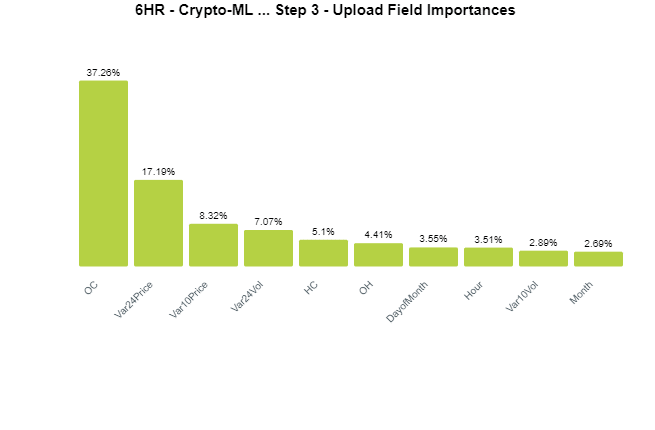
These Summary Reports are important. If the weightings here don’t make sense, then you may need to reconsider your data set. Or, if you see a field that shouldn’t be there, you need to go back and exclude it. For example, Volume should not be in that first image.
Avoid “time series” algorithms
There are many different algorithms to use with machine learning. This creates a problem: if the human takes the wrong approach, they may incorrectly come to the conclusion that machine learning can’t answer the question.
If you search for machine learning exercises on trading or Bitcoin price prediction, you will invariably find people who say it can’t be done. They’ll provide highly technical examples and breakdowns showing that machine learning doesn’t work for trading Bitcoin.
But was the problem actually with the human?
It’s easy to see a Bitcoin price chart and notice the fluctuations over time. Since the data is presented in a time-chart format progressing left-to-right, people assume the best approach to predict the future price is to use a time-series algorithm.
Caution: don’t use time-series algorithms for trading.
However, there is a major fallacy here. Somewhere around 90% of the time, price moves in the same direction as the previous movement. Therefore, the safest bet is to project price out on a continued trend.
Being right 90% of the time is pretty amazing, so the machine learning model will simply tell you that the trend will continue. This isn’t useful for traders.
Being more sophisticated in the lab
The “Model” option we showed you can be highly effective, but you may be able to find better results by taking a more sophisticated approach to machine learning.
Here are some options to consider:
Automatic optimization
Before clicking the Create model button, flip the Automatic optimization slider to on. This will generate many models and perform iterative improvements as it goes.

Use OptiML instead of just Model
OptiML automates the time-consuming tasks you’ll face in machine learning. The two most important pieces it automates are:
- It will split out your data to create a training set and an evaluation set. This means your algorithm will learn based on a random portion of your data, and then test it out against the subset that was withheld.
- It will process through many iterations of algorithms to find the best solution. This can save you many hours.
The following image gives you a visual of OptiML in progress. It has split the data into two sets, one for training and one for evaluation. Not only that, it has done 5 variations on these splits. Nice time saver.
It then passes the training sets through a variety of model types. As the last step, it evaluates them against the evaluation sets. Again, huge time saver.
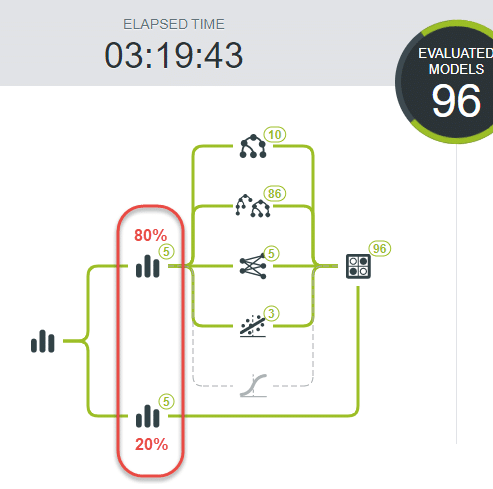
Since we want to have a model that can export to Excel, follow these steps:
- From your Dataset page, choose OptiML in the dropdown instead of Model.
- Expand Advanced configuration.
- Deselect all “Models to optimize” except Models.
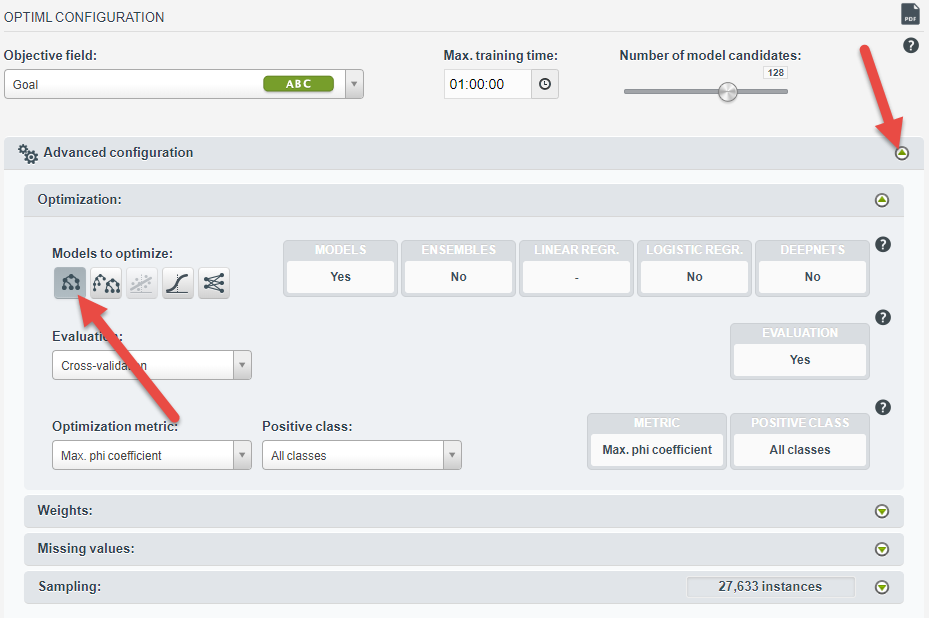
Be prepared to wait. This might take you days to complete manually. BigML is much faster, but it will still take hours.
Doing this will make you appreciate the efficiency of creating a single Decision Tree model.
Part 7: Evaluate your machine learning model
Now we need to find out if your model is any good! BigML handles this via Evaluations. If you have your model open, click the cloud icon and then Evaluate.
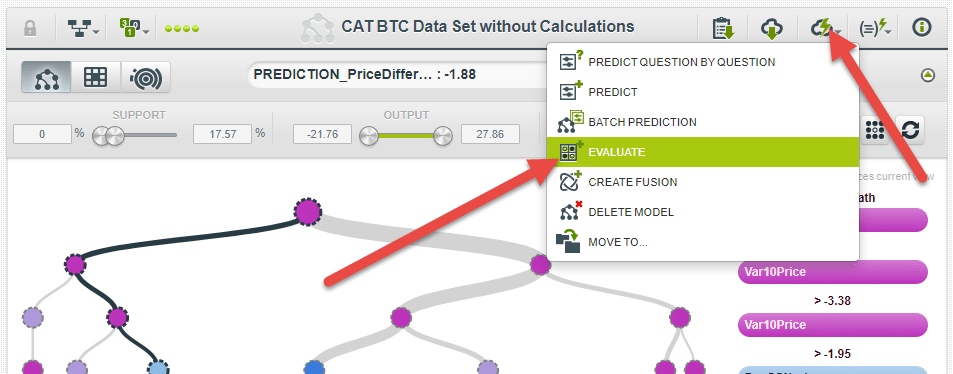
Note: if you instead used OptiML, the evaluations are already done. You can simply click on the evaluation page to see your results.
Training versus evaluation datasets
After clicking Evaluate, you select a dataset to compare against.
Ideally, you train on a random 80% of your data and evaluate against the remaining 20%. When you create your initial dataset, it gives you an option to break out your data in this manner. Or OptiML does this automatically.
But if you didn’t do this yet, don’t worry. You can consider that as you refine your future models. For now, you can just select your original dataset to compare against. What does this do? It will compare the model’s predictions against the actual answers (goals) you gave it.
Taking this concept a step further, you can use evaluations to test exactly how robust your model is. Perhaps you trained on 2018 data and you evaluate against 2019 data. Here are some breakdowns to consider:
- Train on a random subset, test on the remainder (OptiML default).
- Train on one time period, test on another.
- Train on one market dynamic (bull market), test on another (bear market).
- Train on Bitcoin, test on Ehtereum.
None of these are required as you start, but as you think about improving your approach, you can bring in additional testing methods.
R-Squared is your effectiveness
For continuous data, BigML will give you an R-Squared value. R-Squared is a statistical measure that tells you how much error is removed from the predictions.
The value can range from 0 to 1. If you have a 1, you removed all of the error from the predictions. While the strict definition is more complex, this basically means you’ve perfectly predicted the actual results.
For a better definition, see this great Khan Academy overview of R-Square.
Let’s look at some examples. Here’s a model that gets a 0.51. Not bad.
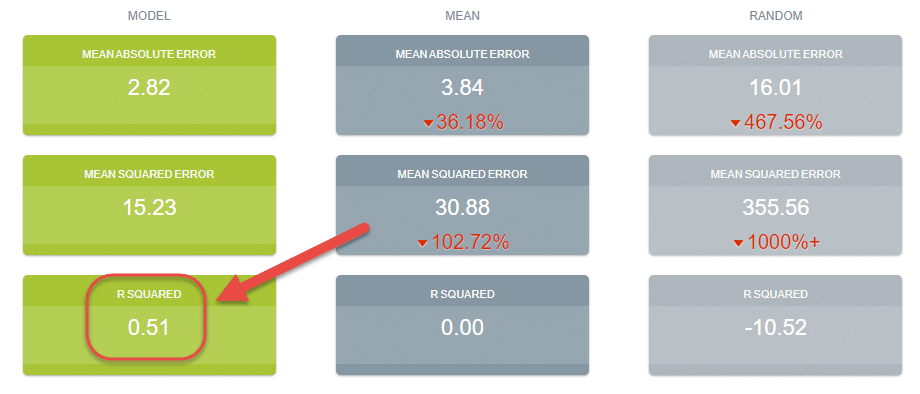
And here’s a model that gets a 0.89. Assuming this is a test against data the model wasn’t trained on, that’s very good.

As a final note, if your goal is not continuous, you will be presented with a different measure of effectiveness. For example, if your goal is categorical (BUY, SELL, or HOLD), then you may see “Max. phi coefficient.” This is just another measure of accuracy that has similar principles.
Caution: While it’s valid and generally directionally correct to evaluate against the training dataset, before placing actual trades, you must pull out a training subset so that you can evaluate your model against data it has never seen before. And again, the easiest way to do this is to use OptiML.
How important is a good R-Squared?
Curious how valid R-Squared is as a measure? Check out our results here. We trained several test models and then backtested them in our trading program. Here’s the results each was able to get:

Improvements in your R-Squared have big implications for your results.
By doubling the R-Square, we are able to get results that are 79 times better. That’s incredible.
This makes sense: the better you can predict the future, the better your trading will be.
Part 8: Download and use your model
Once you have created a model you are satisfied with, you can export it to Excel so that you can start using it. Go to your model page and click that download icon.

After clicking Download Actionable Model, choose Excel as your format and download.
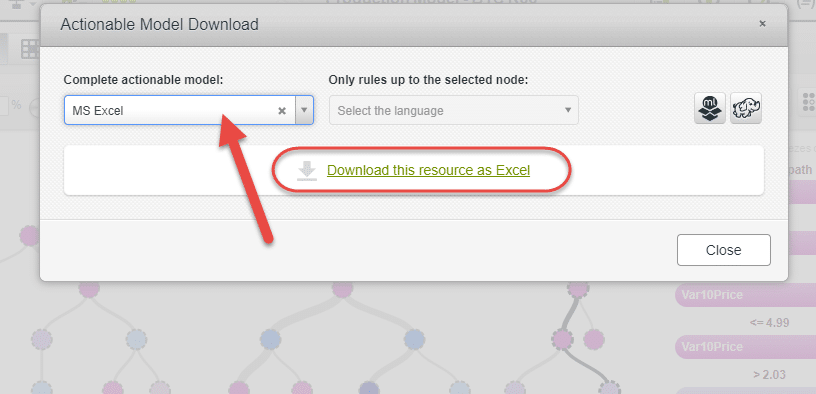
Now you have your machine learning model ready and able to predict for you.
Using your Excel model
Opening the new spreadsheet, you’ll see a yellow highlighted row. Simply enter your inputs into that row and the model will output its prediction and a confidence value to you.
That is, you grab the current market data, enter it into your spreadsheet to perform any calculations, then paste those numbers (such as your Var10Price) into the yellow row. After filling all numbers, you’ll get your prediction and can take action.
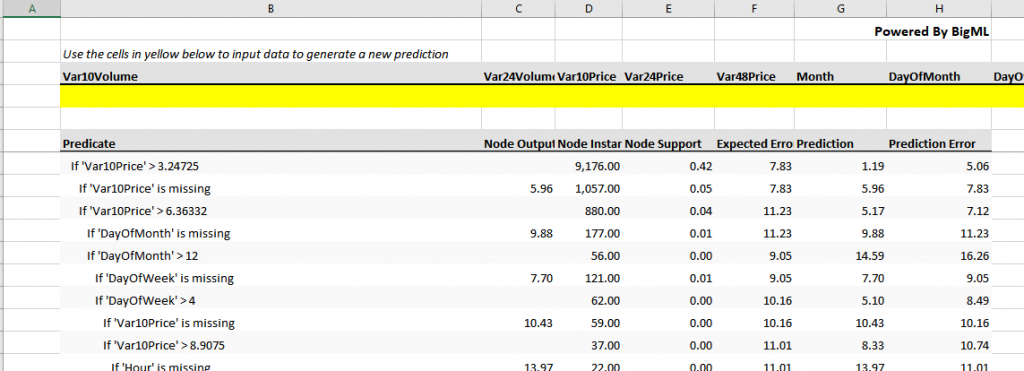
That’s it! You have successfully created a model you can use in real life. This is a highly powerful tool that has the potential to be much more sophisticated and reliable than any technical indicator, piece of news, or so-called expert.
Bitcoin price prediction next steps
This was a massive article.
You now have a great introduction to how machine learning can help you be a better trader. With continued study and experimentation, you will undoubtedly make a breakthrough and hopefully gain a much greater understanding of trading and market dynamics.
But there are plenty of places to go from here. Some suggestions include:
1. Automate a data capture and input system
In order to continuously question your model and get a prediction, you need to automate the capture and input of data.
If you have programming skills in this area, then great.
If not, you can explore options like IFTTT or Zapier to connect different data sources to your calculation sheet and ultimately your model.
At Crypto-ML, we primarily rely on Java, web services, and a microservice architecture to bring everything together.
2. Develop a trading system
Having a prediction is great, but you also need to know what to do with it. When do you take action? Building a systematic approach to acting on the predictions you get can automate your trading decisions.
Coming back to what your Excel model provides, you receive output consisting of two values:
- Prediction
- Confidence level
Based on these values, when would it make sense to open and close a trade?
You can set some basic parameters and backtest. Or better yet, you can approach this complex, math-centric problem with another machine learning project.
3. Expand your machine learning lab
This article solely touched on Decision Trees, which are a subset of supervised learning algorithms. You have opened the door to one room in a 100-story building. There is much, much more to machine learning that you can explore as your interest and expertise allow.
BigML handles many types of algorithms with equal ease. The following screenshot shows OptiML not only splitting training and evaluation data, but also working through a variety of algorithms to find the best one.
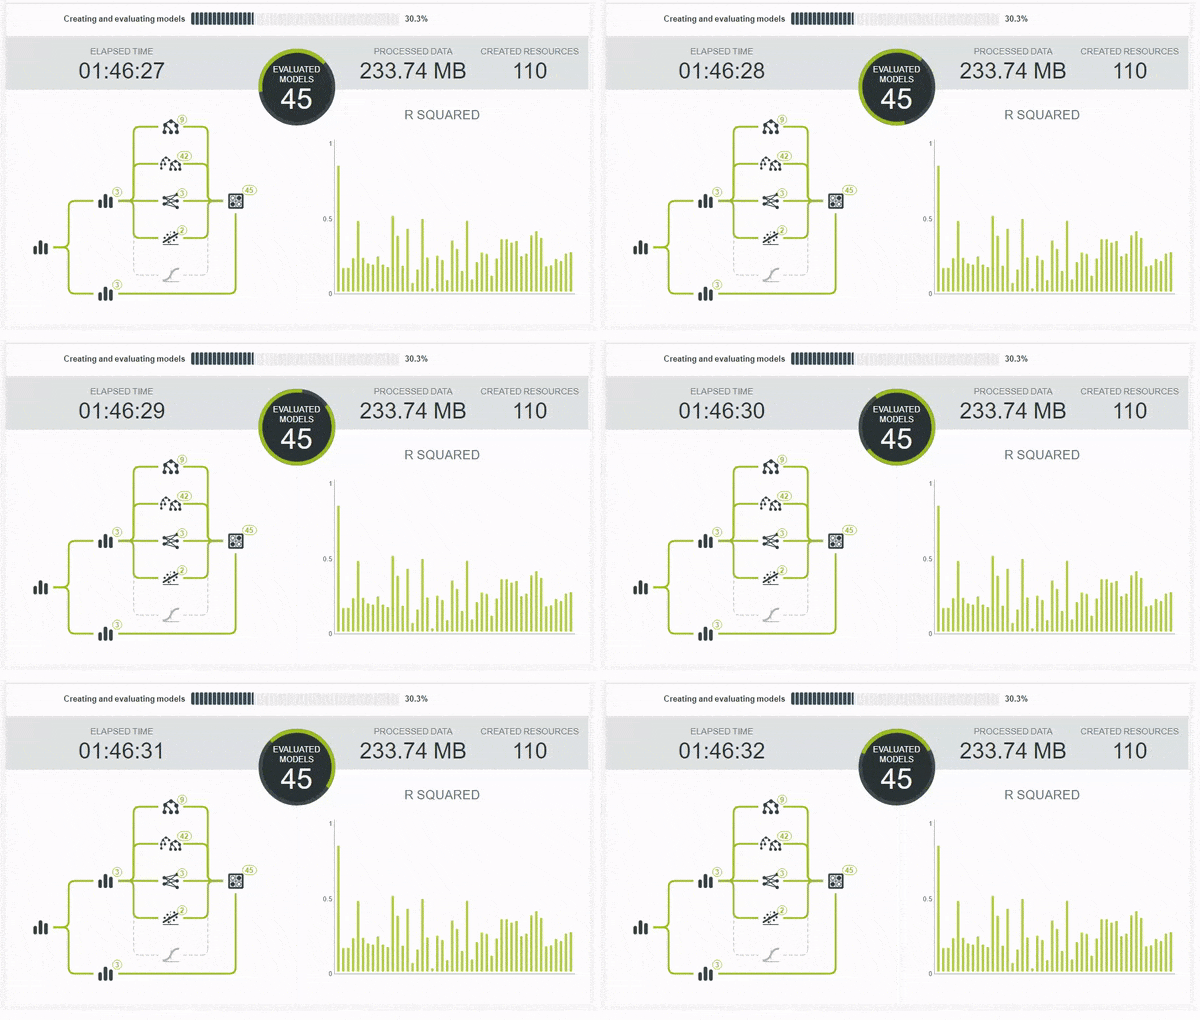
Outside of BigML, there are many other amazing machine learning resources that may be a better fit for you:
Crypto-ML uses AWS and Azure heavily. Both are great platforms. TensorFlow is the go-to option for most machine learning training. If you want to take courses, you will almost certainly find yourself coupling Python with TensorFlow. Do a bit of research to see which option is ideal for you, then dive in.
Conclusion
Thank you very much for reading and we hope this has been an informative, practical project for you. As you can see, with some basic knowledge, creativity, and determination, you can create an incredible solution. As machine learning becomes more and more accessible, your capabilities will continue to grow.
Do you have questions, corrections, or insights? Have you created a successful Bitcoin price prediction model or are you stuck?
Please share with us!
10 thoughts on “Bitcoin Price Prediction with DIY Machine Learning in Excel”
Leave a Comment
Subscribe to the Newsletter
Join 7k+ working professionals to "The Five-Year Plan". Every Saturday morning, you'll receive one actionable tip to create life-changing wealth in crypto.


Congratulations for the post, excellent quality content. I have a doubt when preparing the data for the technical indicators, what is the criterion to be used for preparing the data? when should i use percentage change, normalization or standardization ?. Examples of indicators: RSI, MACD, DM +, DM-, ATR, ADX … among others.
Thanks.
Fabricio
Thanks for reading and the great question. The answer is to ask whether the technical indicator is already normalized or not. In other words, if Bitcoin was around $1,000, would the values from the indicator be different than if Bitcoin was around $10,000? Many indicators have values between -100 and +100. That’s good and tells you it’s already normalized. RSI, for example, bounds its values in this way. So you can use it as is. Same goes for ADX–it’s already normalized. MACD, on the other hand, does not. It uses absolute values and you’ll see its output change as the price of Bitcoin changes–that’s what you want to avoid. ATR is the same–it is not normalized either.
To key things to look for: is the indicator’s output expressed as a percentage? Or is it always bound within a range (like -100 to +100)? If either of those are true, you’re good to use it as is.
OK,
I believe that I understood the criterion, we must first analyze each particular case, and check the behavior of the indicator at different times to see if it is varying within a fixed range, if not, it would supplement a normalization. When I need to normalize, what will be better? normalize (-1 ~ 1), standardize (0 ~ 1) or change the percentage (0 ~ 1) ?. My project is being done entirely in python, but it is being very interesting and useful the concepts and tips given in the post.
Thanks.
Glad it’s helpful. And yes, whether you’re doing this in Python or something else, hopefully, there are some good concepts to consider.
If you need to normalize, it’s generally simplest to change to a percentage but any of the options you gave will work.
Keep us posted as you progress on your project!
hi admin do you have a vdo explain how to do? it’s kinda confuse how to use and i dont see any graph of BTC prediction in this blog after upload data into bigML. it is just plot chart. how to determine the forecast?
Hi and thanks for the question! We will be doing some videos on this topic but do not currently have any. This will not generate a forecast plot (that would be more of a time series approach). Instead, the output is the predicted value for X periods in the future, such as 24 hours in the future. Check the part above on “Define Your Question” and also this part: https://crypto-ml.com/blog/bitcoin-price-prediction-with-diy-machine-learning-in-excel/#Calculate_your_answer_goal
is this only model the current crypto-ml has? or any other model it has?
Hello Karthik, thanks for the comment. This post is designed to help introduce concepts to people exploring this topic. While some of these ideas are woven into Crypto-ML, this is not the system or architecture Crypto-ML uses to generate signals.
What are the ML Models you’re currently using in your Crypto-ML
Our general predictions and manipulation detection use BigML’s Deepnets. These are most similar to this article. But we use other systems as well.
You may consider viewing this: https://crypto-ml.com/blog/how-crypto-ml-works/