Algorithm Breakdown
Crypto-ML utilizes machine learning to identify Bitcoin’s Risk Index.
This guide walks through how this technology is used so that you can better understand our platform’s strengths and limitations.
Why Machine Learning
If you have ever looked at a day trader’s charts, you will quickly realize the amount of data available to traders and investors is massive. Successful traders have often spent a decade or more staring at charts. Over time, they build an intuitive feel and find patterns they can rely on. Each trader develops their own secret sauce.
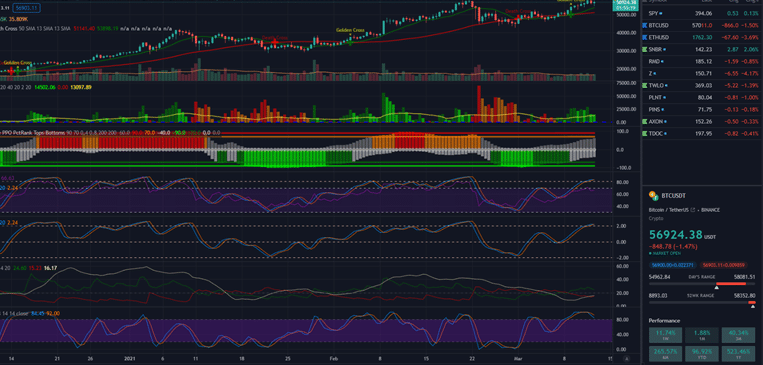
While some humans find success, computers are much more effective at finding patterns in large data sets. In fact:
- In a decade, a human may begin to recognize a limited set of patterns.
- In 24 hours, a computer can consume millions of data points and determine which patterns apply in which circumstances.
Said another way, the learning phase can be compressed from years to hours while at the same time:
- Considering much more data.
- Delivering precision that can be measured and benchmarked.
Machine learning is the ideal tool for finding patterns in the market and delivering effective predictions.
Data Sources
Crypto-ML customers are curious about the type of data Crypto-ML uses to generate predictions. This section will describe the reason and provide information on other data sources that Crypto-ML has tested, is aware of, and continues to monitor.
Insider Pro members can access our full data set which is updated daily. It currently includes 57 raw and transformed data points. Financial data is expensive to gather, transform, and store. If you run your own machine learning projects, this data can save you hundreds of dollars per month.
Access our Bitcoin data for machine learning.
Crypto-ML Price Predictions
Our price predictions make use of data covering the following areas, which will be further explained below:
- Macroeconomic
- Global market indexes
- Commodity indexes
- Exchange
- Technical indicator
- Social sentiment and volume
- Search sentiment and volume
- Bitcoin dominance
Exchange Data
Exchange data is the source data for Crypto-ML and nearly all trading bots/platforms. Exchange data meets several critical requirements for machine learning (and trading in general):
- Reliable
- Available at any interval
- Detailed: namely Price (Open, High, Low, Close), Volume, and Order Book
But apart from these convenient factors, this generally held assumption is critical: price is the sum of all currently known data points. Exchanges are efficient markets and therefore consolidate all relevant information into a single source.
Further, exchange data can be further elaborated into technical indicators, such as RSI, Stochastics, Moving Averages, and many more.
Social and Search Data
Sentiment data is available from both social media and search sources. This type of data indicates how much people are thinking about crypto and what their general sentiment is. This is key to identifying fear and greed cycles. Crypto-ML monitors social sentiment, consuming the following types of data:
- Google Trends
- News sites
- Social aggregation services
Traditional Fundamental Data
Fundamental data is operational data about the business or asset. For stocks and most assets, this data is reactive. It is reported at end of each quarter after events already happened. Fundamental data can be challenging for ML because it is not available via a stream.
If fundamental data was to be considered, it would have to be analyzed in a broad-market context and not specific to the asset. Fundamental data is probably best suited for long-term investing.
Economic Fundamental Data
Certain stats summarize how the global markets are functioning.
- GDP
- Jobless Claims
- Consumer Price Index
These stats are also reactive and not available at the rate we need for trading.
Secondary economic data may also include:
- S&P500 price
- Bond prices
- Global indexes
- Commodity prices
- Bond rates
- Yield curves
- Dollar Index
- Exchange rates
These values are critical to long-term price movements as they determine money flow in and out of markets, including crypto markets.
Crypto Fundamental Data
There are numerous fundamental data points for crypto:
- Number of users, new and active
- Number of transactions
- Exchange inflows and outflows
- Fees
- Miner data
Our research indicates crypto fundamental data is not currently useful in predicting price movement. Crypto is quickly growing and gaining market share. As such, most of these metrics just go up over time. In general, they also tend to lag price change. If Bitcoin has a huge rally, we see many new members join.
However, Crypto-ML continues to monitor these data sources for predictive patterns.
Primary Data
Primary information is data that can lead to changes in fundamental data. For example, if Exxon purchases an unusually large quantity of tankers, that may indicate a predicted long-term imbalance in the supply and demand of oil.
Depending on your asset, primary data may be incredibly valuable. But it will need to pass a couple of tests:
- Is the data readily available?
- Are there sufficient variances in the data to provide a historical reference?
Crypto-ML does not currently consider primary data.
Crypto vs Traditional Markets
In attempting to predict price movements, the cryptocurrency markets provide several key advantages over traditional markets:
Crypto Advantages for Machine Learning
- Markets are open 24 hours per day, 7 days per week
- Markets are highly volatile, which provides plenty of signal-to-noise
- Traditional fundamental analysis doesn’t apply. Crypto does not have quarterly reports. There is less to analyze and react to.
Crypto Disadvantages for Machine Learning
- High degree of manipulation: large players make fast, large moves at the expense of smaller players.
- Strong control by large entities
- Low regulation
- Minimal exchange controls in place. Traditional markets have exchange alarms and closure conditions.
- Exceptionally fast moves: double-digit price changes can occur in seconds.
- Markets are immature:
- Minimal historical data exists.
- Bitcoin was not mainstream until 2017, which altered behavior patterns.
- Financial institution engagement is just now emerging, which will further alter behavior.
Neural Networks
As part of our Release 5, Crypto-ML upgraded machine learning backbone to neural networks. Neural networks are the ideal tool for taking a large amount of data and then finding patterns that can be used to generate predictions.
Crypto-ML’s neural networks fall under a supervised learning category, meaning we provide a goal. We are providing data and then asking the network to predict a specific value. In our case, we want the neural network to create a model of the markets that is able to predict price 6 hours from now and 12 hours from now.
Our system ingests a large quantity of exchange data, converts that data into many vectors (called “features”), and then submits them to a neural-network created mode that will give us a prediction.
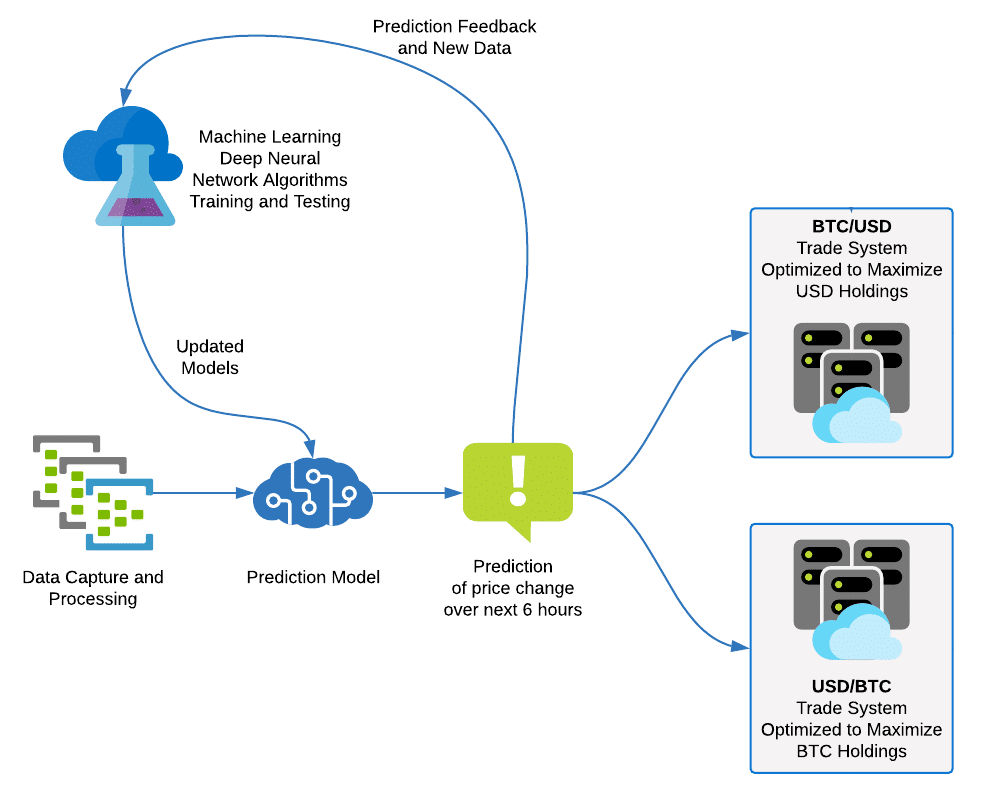
In addition, as new data comes in, we can continuously train new models for future deployment. This feedback allows our models to adapt and change as the market evolves.
► Learn more about Crypto-ML Neural Networks
Deep Learning
Whereas Crypto-ML uses neural networks for its supervised learning in order to deliver Crypto-ML Standard and Manipulation Detection, we also use a variety of deep learning techniques for unsupervised learning.
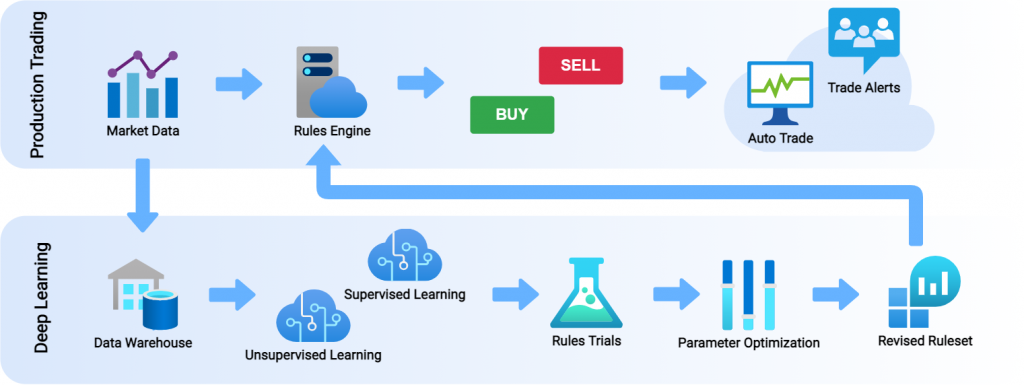
Fundamentally, unsupervised learning is a research-oriented approach to finding rules, clusters, outliers, and dimensionality in data. This explores data in a deep and meaningful manner but is not directly predictive.
Our approach is to feed the building blocks of technical market data into the system. It can then find patterns and effectively recommend its own soup of technical indicators. This approach is incredible and produces findings that are highly counterintuitive.
For example, if we consider an indicator like Bollinger Bands, traditional analysts would recommend selling when price extends above the upper band. However, our system may say it is bullish when the the upper band is rising and also separating from the lower band.
Optimization
Optimizers are used to set parameters of variables in a way that maximizes, minimizes, or sets a particular objective variable. Fundamentally, they run a high quantity of simulations (albeit in a smart, search-oriented manner) to find the best solution for a given set of constraints. An optimization algorithm runs to create a model you can use in the future.
Optimizers may be referred to as:
- Operations research functions
- Solvers
- Search algorithms
Optimizers are one of the earliest classes of machine learning algorithms used in practical, production environments. They have built environments around us for decades, answering questions such as:
- How should a city set stoplight timing to maximize traffic throughput?
- How should a bank configure its floorplan, parking lot, and drive through so that customers wait as little as possible?
- How does UPS optimize the delivery of millions of packages every day by air, sea, and land?
- How should United Airlines establish routes to maximize cost efficiency?
Trading is full of parameters that need to be optimized. This includes thousands of complex parameters, such as the periods to be used for a given moving average or indicator.
Additionally, Crypto-ML must take the predictions from the neural networks or the output of the rules-based engine and then feed them to a trading system. This trading system must determine what thresholds trigger a trade to open or close. The trading system itself is made up of numerous triggers all optimized to product the maximum portfolio value over time.
Last, neural networks have many topology parameters. Crypto-ML utilizes optimization algorithms to tune its neural networks.
Testing and Performance Metrics
In order to deliver the best predictive capabilities, all of our models are tested with high standards prior to release to production.
Once in production, we also continuously measure predictions against reality to ensure we have real-world validation and can quickly identify if performance is slipping.

Lab Testing: R-Squared
Prior to releasing models, we look at numerous metrics. However, R-Squared is our key performance metric for regression models. It proves out directly in trading results. R-Squared tells you how much error you have removed from the predictions. It is the percentage of variance that is explained by the model.
We evaluate our models against data the models have never seen before. Said another way, data used to train our models is not used to test our models. This is done via cross-validation:
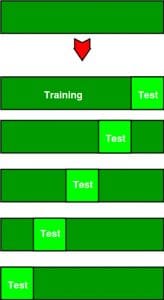
While R-Squared doesn’t tell the entire statistical story, we were able to demonstrate its relevance in our Bitcoin Price Prediction with DIY Machine Learning in Excel post. When we pipe models into our trading system, the results directly correlate with their R-Squared value.
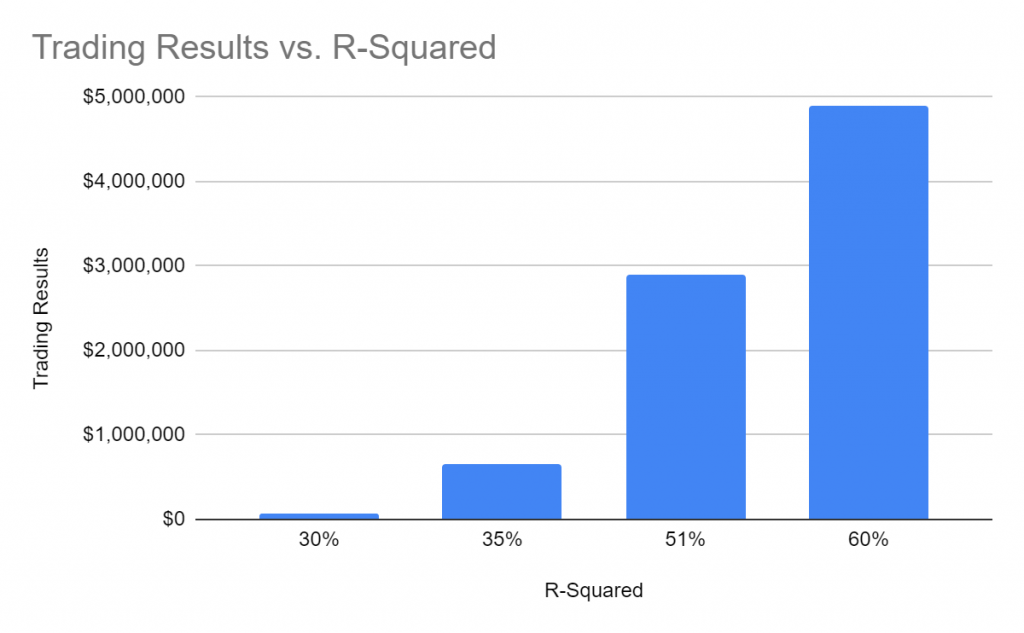
In fact, by doubling the R-Squared value, we were able to achieve results 79 times better.
The following chart shows the difference between the 4.x and 5.0 models. By using Deep Neural Networks, we are making a large jump in precision.
- The BTC model increases by 2.5x
- The ETH model increases by 1.7x
While there are always ways to improve systems, as you can see by that chart, 5.0 brings us to a near “limit of precision” given current circumstances.
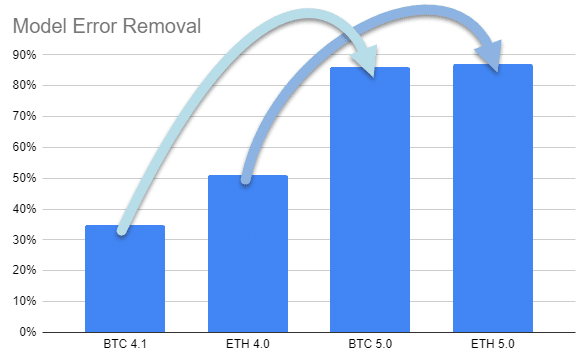
Our current models vastly outperform these older models, as we are now consistently delivering R-Squared values in the 93% to 97% range.
Machine Learning Challenges
While machine learning technology has many strengths, it is still no more than a tool to help traders become effective. It requires considerable expertise and domain knowledge in order to apply its capabilities effectively. There are many open problems, but a few of the key ones to be aware of:
1. Pattern matching bias: machine learning can find a model that successfully predicts a large portion of market movements. For example, our model might determine that 95% of the time the pattern emerges, the market moves up by 2%. However, during the other 5%, potentially the market moves down by 10%. This problem can also occur when your data has a low signal-to-noise ratio, few samples of a certain condition, or a bias toward a particular type of market. Anytime a bias is overlooked, it can lead to danger in production. Our Manipulation Detection model attempts to address this challenge.
2. Overfitting: commonly called the “greatest challenge in finance,” overfitting refers to models working very effectively on past data but not on new data. That is, the model was trained to fit the past perfectly, but unless those exact patterns emerge again in the future, it will fail. Rather, you should target a model that finds more general patterns that apply across many markets and many conditions. Crypto-ML uses advanced techniques to manage overfitting, including training on a random subset of the data, performing stepwise evaluations, dissecting performance in all various market stages (bull, bear, sideways, etc…), and breaking down results by multiple timeframes. Read more in our statistical measures discussion.
3. Last trade: this is what we believe is truly the “greatest challenge in finance.” During a strong bull run, patterns seem to match all the way up to the top of the run, which means you have many great trades going up, but likely also end up with a trade open right at the peak (the “last trade”). If the market drops quickly from the peak, you will be stuck with a trade open and an accelerating drawdown. This is challenging because choosing to exit the bull run early may cause you to miss out on many great trades. If you exit and are wrong, you miss out on the considerable opportunity. But exiting too late will leave you with a large loss or drawdown. The moments leading up to the end of a bull run vary significantly, making the patterns difficult for machine learning to consistently identify.
Until these challenges are entirely solved, each must have mitigation or management in place.
Build It Yourself
Do you want to try a do-it-yourself project to generate your own price predictions?
We have created a 101-level DIY project that gives non-developers and developers alike the opportunity to build a true price prediction ML system. If you have Microsoft Excel, you’ll have everything you need.
This is not a like-for-like build of Crypto-ML, but it does take many of our core concepts and strip them down to easy-to-understand essentials that almost everyone will be able to relate to.
If you are an advanced user, such as a software or machine learning engineer, you will still learn a considerable amount about predicting prices in the finance sector.
► Get started with your own DIY Machine Learning Price Prediction Project
Subscribe to the Newsletter
Join 7k+ working professionals to "The Five-Year Plan". Every Saturday morning, you'll receive one actionable tip to create life-changing wealth in crypto.