
Insider Newsletter 13: January 2023
Has the next great Bitcoin bull run started? Or are we in the midst of a sucker’s rally and dead cat bounce?
To help you understand the market and determine your actions, we’ll give you an in-depth look into our Crypto-ML indicators, the economy, on-chain metrics, and technical analysis. Let’s address FOMO with numbers.
Here’s a summary:
| Section | Summary | Mid-Term |
|---|---|---|
| Crypto-ML Data | The Market Index is calling for caution but the price channels point to this still being a good long-term DCA level. The AI prediction is signaling we’re likely in a bull trap. | Mixed |
| Economic | Inflation may have peaked, indicating the bottom is in. But recovery may take through mid of 2023, resulting in limited liquidity for investing. Finance and tech are calling for more pain ahead. | Bearish |
| On-Chain | Numerous mid and long-term metrics point to a bullish reversal. | Bullish |
| Technical Analysis | Mid and long-term trends have broken, but there will be short-term profit-taking. | Bullish |
Actions We’re Taking Now
Since actions speak louder than words:
- Sold large BNB position and moved to BTC. This minimizes exchange exposure risk.
- Not trying to time the bottom! Continuing to dollar-cost-average into BTC. From a macro perspective, we may have another 6 months of challenges.
- Prepared to invest lump sums into BTC if the market drops.
We bought continuously and aggressively during the second half of 2022, so we’re also ready to sit back and enjoy the ride-up if the market does go on a run. Our Market Index helped us invest while others were fearful.
If the market stagnates or drops, we’ll continue to buy more.
Crypto-ML Data
The long-term growth model shows we’re still in a good entry zone for long-term investors, but mixed readings elsewhere point to us being in a bull trap.
30-Day Price Prediction
Prior to this bull run, the Price Predictions began putting out numbers in the -18% to -20% range. Obviously, this did not play out, but it’s common for ML to predict extreme readings ahead of extreme events, even if those predictions are in the opposite direction.
In effect, the ML knew something big was going to happen. Based on the data it has, it was a higher probability the break would be to the downside.
This graph shows the predicted 30-day percent change in Bitcoin price compared to the actual.

There are several possibilities:
- The probabilities truly did favor a drop. Given the macroeconomic picture, this is a safe bet. But the markets moved against the odds.
- The data available did not paint a complete picture of what transpired. Additional data points may have helped improve the prediction.
- There is some degree of market manipulation at play (bull trap) and we will still see a major drop.
The negative predictions are concerning and do support a bull trap hypothesis.
Price Channels
The Crypto-ML Price Channels use a regression model to plot the long-term growth pattern of Bitcoin.
After exiting the life-long growth model in September, Bitcoin is nearing reentry. It will need to hit $26,700 to do so.
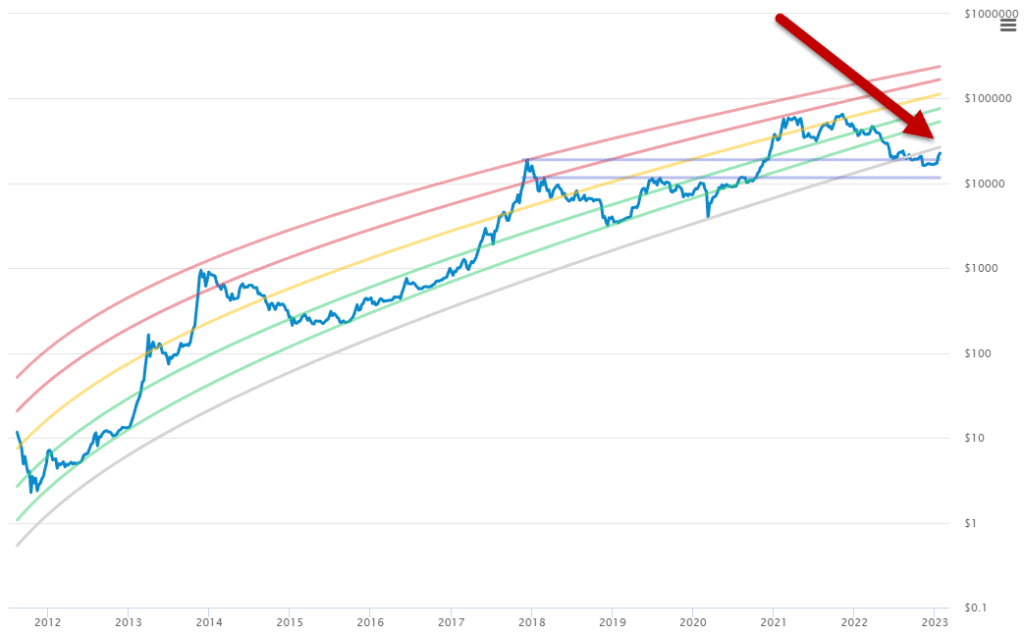
Assuming Bitcoin continues its growth pattern, we’re still in a solid buy zone for long-term investors.
Zooming in shows just how narrow the gap has become.
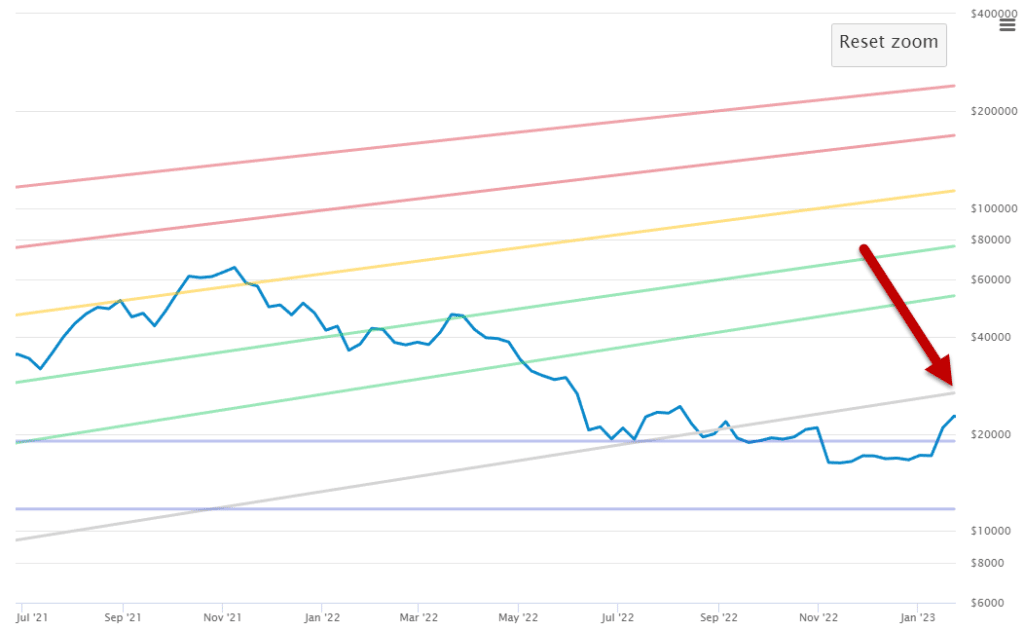
Based on this, continued dollar-cost-averaging is an easy recommendation for long-term investors.
Market Index
Our Market Index looks at technical indicators and also social and search sentiment in order to determine overbought and oversold zones.
It helps you invest when others are fearful and then take profit when others are greedy.
Here, see people have become excited and moved bullish. This tells more sophisticated investors to be cautious and fight the FOMO.
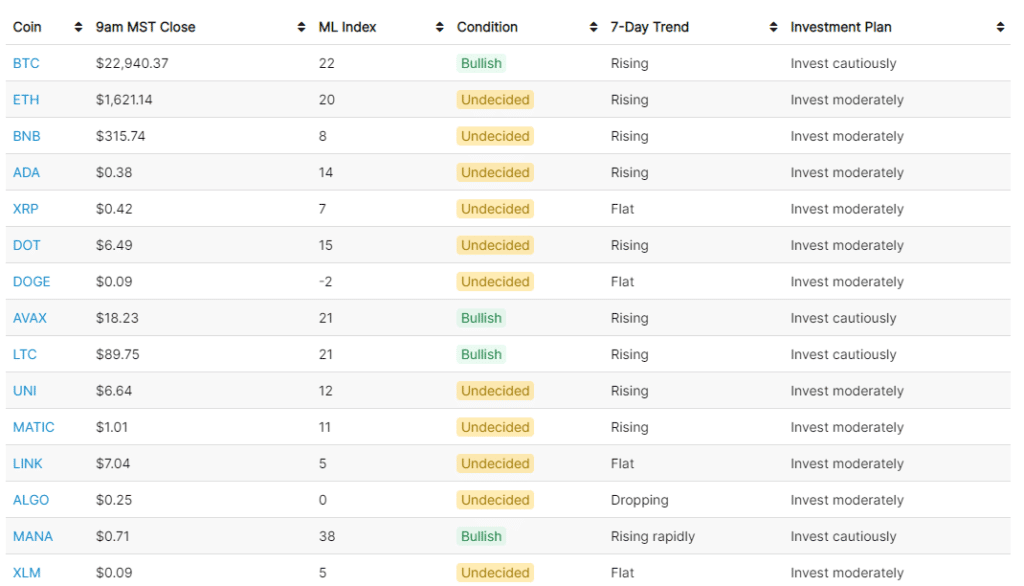
Levels in the 20s are not yet extreme, but it is a less optimal entry point than readings in the fear and extreme fear zones.
Macroeconomy
Thanks to new CPI numbers, there is reason to think the economic bottom is in. That said, companies with deep data in big tech and finance are all positioning themselves defensively and reducing costs. Most analysts are calling the current run a bull trap.
The chart below is what has markets excited. In January, it was announced US consumer prices (CPI) fell in December. This may be interpreted as the economy having effectively bottomed out.

That doesn’t mean it has recovered though.
The Consumer Price Index inflation gauge rose 6.5% year-over-year, meaning prices are still rising at a rate way above the central bank’s 2% target level.
Fundamentally, the monetary tightening has been effective, but the Fed will continue the course until the 2% target is hit.
“We haven’t seen wages falling to the extent that would suggest being on track to hit the Fed’s inflation target and so the Fed will continue overtightening, which means getting above 5%, probably to 5.25%. And then importantly, staying there.
They need more evidence to prove that they have truly brought inflation under control — until they get there, they will hold rather than cut.”
Karim Chedid – BlackRock Strategist (businessinsider.com)
Former Treasury Secretary Larry Summers is worried that investors and economists are becoming overly optimistic after year-over-year inflation cooled to 6.5% in December. He is confident a recession is still more likely than not.
“Be careful of false dawns”
Former Treasury Secretary Larry Summers (fortune.com)
Microsoft’s CEO Satya Nadella is calling for a challenging 2 years ahead, with headwinds through the end of 2024 (theregister.com).
Large tech is cutting aggressively. But this may just be right-sizing after over-hiring over the last couple of years. Either way, these companies have unparalleled access to data and analytics. Their actions should not be ignored.
- Microsoft to cut 5% of its workforce, or 11,000 employees (finance.yahoo.com)
- Google cut 6.4% of staff or 12,000 employees (theinformation.com)
- Amazon to layout 18,000 employees this week in its biggest-ever layoffs (foxbusiness.com)
- Meta is cutting 11,000 and Salesforce another 7,000 or 10% of its workforce (theregister.com)
- Another 15-20% of big tech employees may be laid off in the next 6 months (fortune.com)
Broad surveys of analysts are still projecting tech will return to growth halfway through 2023 (bloomberg.com).
We’re seeing similar caution in finance.
- Goldman Sachs took a larger-than-expected 69% decline in profits (finance.yahoo.com), which is similar to other large banks. Goldman Sachs followed by announcing a cut of 3,000 employees (businessinsider.com).
- BlackRock is cutting 3% (bloomberg.com).
- More financial earnings will be released in the coming weeks.
- JPMorgan is bracing for a correction and hard landing (cnbc.com)
- Morgan Stanley’s Chief Investment Officer says investors are falling for a trap (fortune.com)
CIO and Chief US Equity Strategist at Morgan Stanley is calling for a further 23% drop in the S&P 500 down to the $3,000 level (finance.yahoo.com).
“Today’s CPI reading is another sign that inflation is heading in the right direction and indicates the peak is likely in the rear view. But we aren’t out of the woods yet, as it is still well-above the Fed’s target rate and the Fed has remained adamant that they will keep rates high to bring inflation back to normal levels.”
Mike Loewengart – Hoad at Morgan Stanley Global Investment Office (foxbusiness.com)
Likewise, Bank of America is expecting a bearish rebound primarily due to consumer credit. This means people are still spending and still racking up credit card debt. As people lose jobs and interest rates climb higher, it will not be possible to service this debt.
“Meanwhile, a recession is coming, according to the note, and it’s likely a biggie. That’s because a jump in the unemployment rate will coincide with a dismal 2% personal savings rate, a 15% surge in credit card debt, and a record average credit card interest rate of 19%.”
Bank of America Investment Strategist Michael Hartnett (businessinsider.com)
While this all implies continued volatility and challenging markets, analysts are showing a lower likelihood of recession across markets. The following chart is based on global money managers at and published by JP Morgan.

Despite the odds improving, the odds of a recession hitting the S&P 500 are still at 73%.
Let’s look at the chart:
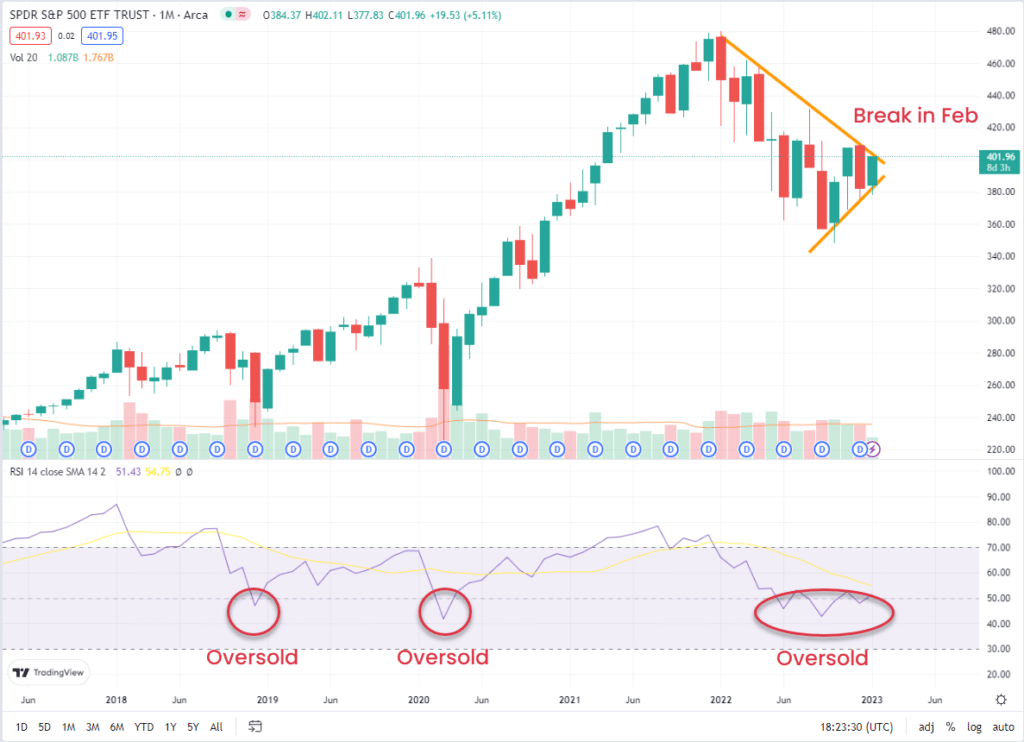
From this perspective, it does appear markets are coming to a decision point in February. The consolidation of price movement will break up or down to start a new trend.
Companies with all of the data (big tech and finance) are positioning themselves to withstand a drawdown and rough 2023, but there is reason to be cautiously optimistic and assume the bottom may be behind us.
Most strategists are shifting their focus from monetary policy to corporate earnings in 2023 (cnbc.com). We’ll do an earnings review in our next Insider Newsletter.
On-Chain Metrics
A much brighter picture is appearing on-chain. Numerous reversal metrics are in. However, there is limited statistical significance to many of these events as they’ve only occurred a handful of times in the past. Past patterns, especially limited ones, don’t always repeat.
The problem with most on-chain metrics is big reversals have only happened a few times in the past. Just because a pattern happened 4 times in the past does not mean it has predictive power.
Rather, there is likely very little statistical significance between these patterns and future price movement.
That said, there are some interesting data points that seem to be aligning well.
Stock-to-flow has significantly stepped away from price, but its relationship with days until halving is about to be tested. The light orange portion of the curve has historically been a bottom indicator. Right on cue, price has turned positive.

The spent output profit ratio (SOPR) measure is another reversal signal. It simply divides “price sold” by “price paid.” When it gets very low, that means investors have given up and sold at a loss. It can indicate panic and despair. Bitcoin has also hit that level.

Miners have stopped selling and instead started buying. These net buying or net selling waves tend to be long-lived. Though they do not always correspond with price action, this should reduce selling pressure in the markets.

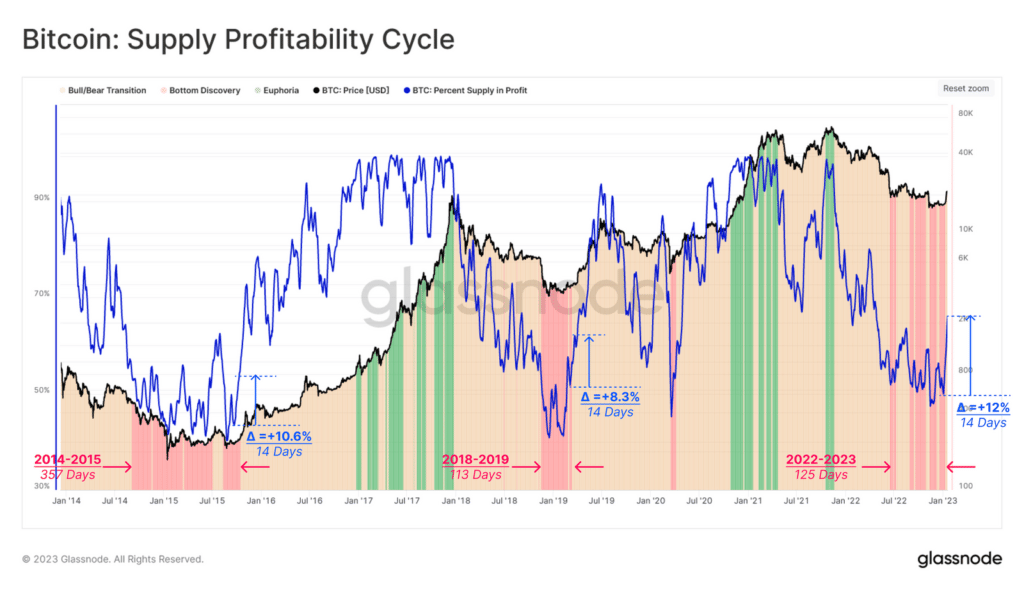
This chart is another look at percent-in-profit. The red areas show “bottom discovery,” which is historically a turning point.
One negative is FTX. As part of bankruptcy, FTX may liquidate up to $4.6 billion dollars worth of assets. An on-chain analysis of wallets shows these assets are across FTT, MAPS, OXY, WBTC, BONA, and SLP (bitcoinist.com).
Selling these assets, even in a staged manner, will put incredible pressure on the crypto markets.
Technical Analysis
Bitcoin has broken many of the long-term bear trend patterns. This generally paints a positive picture. But we are at a point of short-term resistance and may see profit-taking before the next leg up.
Starting with the Bitcoin monthly chart, we can clearly see the $23K level as a major battleground. Based on the descending resistance line, you could argue Bitcoin has not broken the bearish trend yet. January is now the 3rd attempt. In addition, it’s hitting the horizontal resistance from July and August.
A sustained break above these levels will be convincingly bullish.
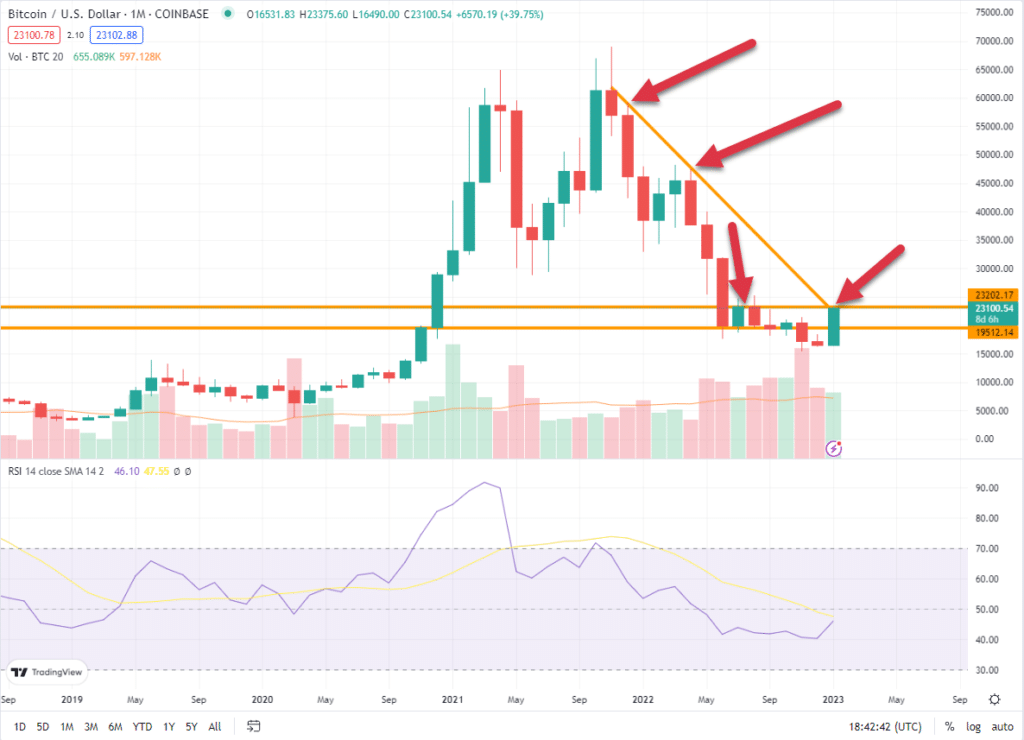
Monthly RSI has reversed and is about to cross over its SMA line, indicating we’re about to break the trend and exit this extended oversold zone.
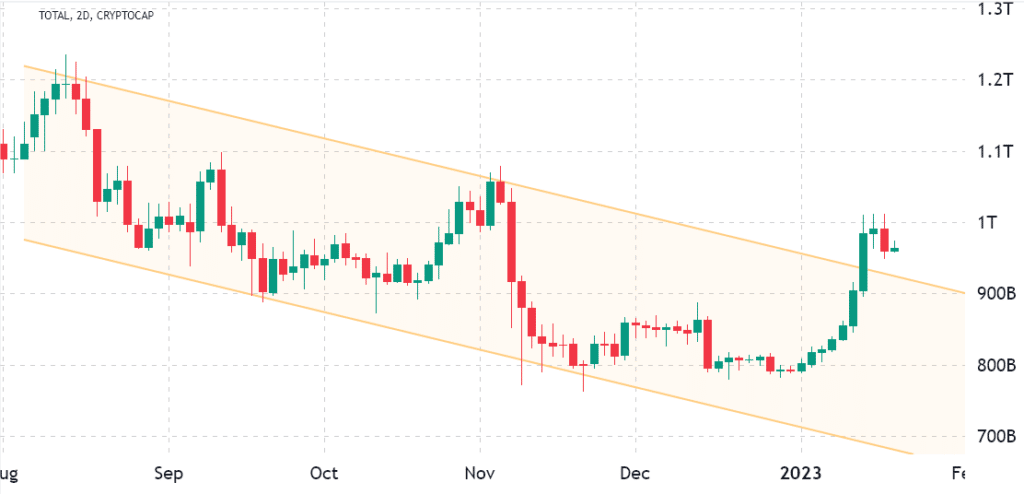
More convincingly, the entire crypto market cap appears to have broken the long-term downward channel.
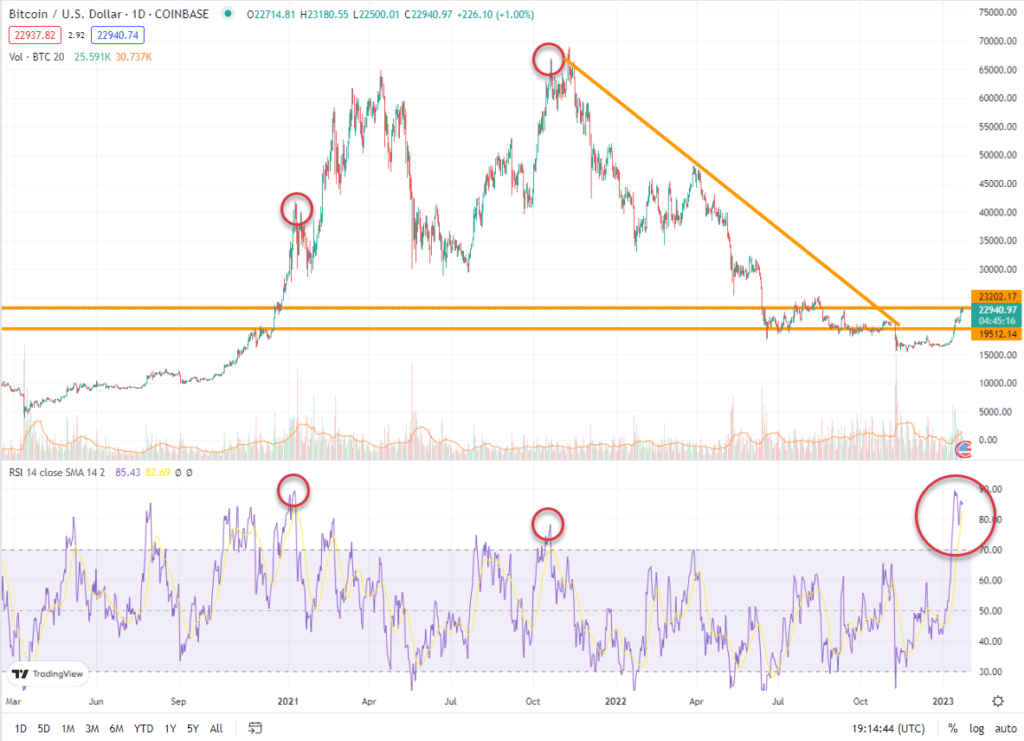
Here is the daily Bitcoin chart with the same monthly support and resistance lines. At this level, the downward trend changed. But RSI is in overbought territory. This means we will see a daily retreat. And it will take considerable pressure to push higher.
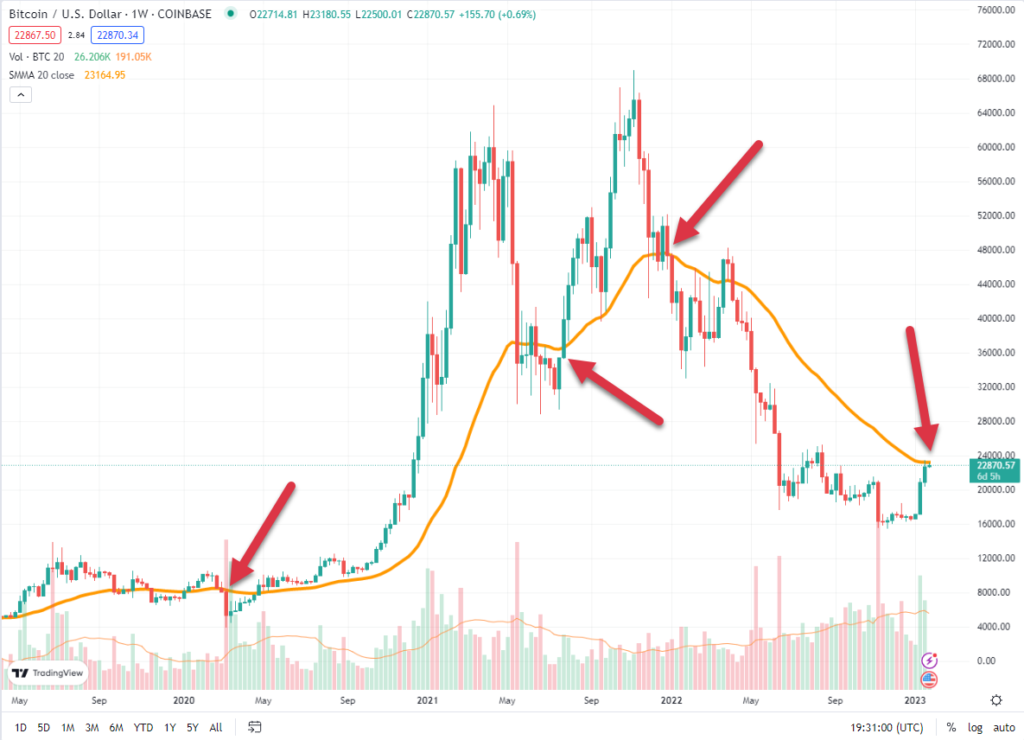
The 20-period weekly SMA has tended to surround itself with massive candles. This has historically been an area of heavy chop and wild price action. This reinforces the above chart. Expect profit-taking.
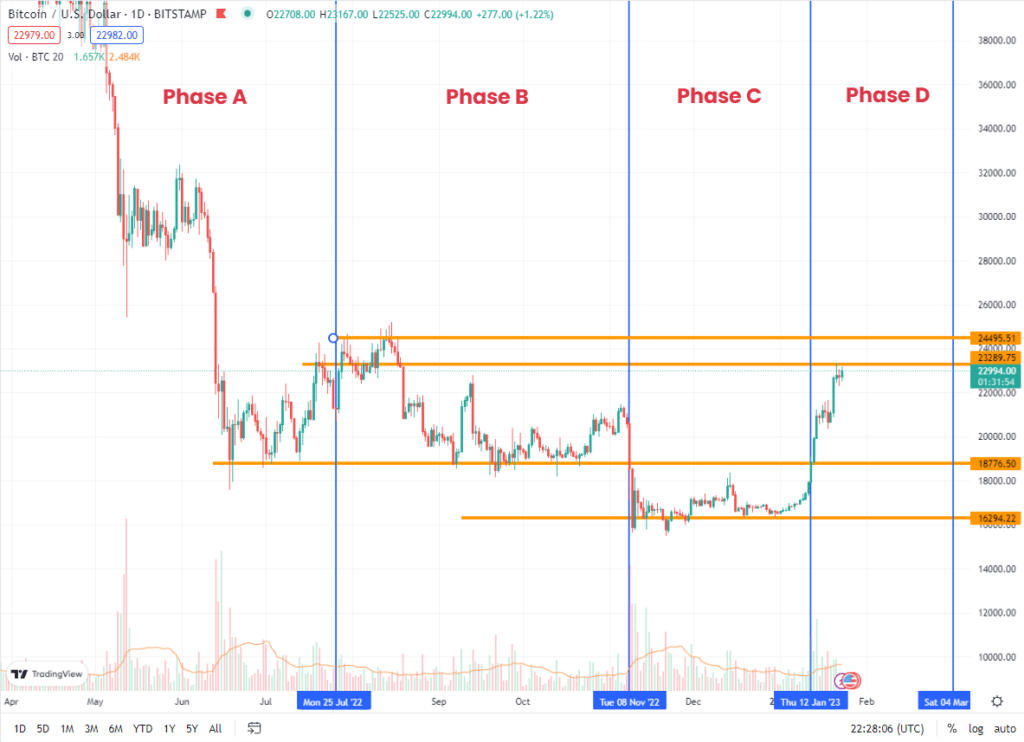
The Wyckoff Accumulation model also seems to apply to the current charts.
Here’s a standard accumulation model, though there are numerous variations:

Lining this up with Bitcoin, we see there may be some chop as Phase D plays out, but that should be followed by the Phase E rally.
Following are charts from 3rd-party analysts.
Here we see Bitcoin appears to be in a reversal pattern, breaking the long-standing downtrend that began in 2021.
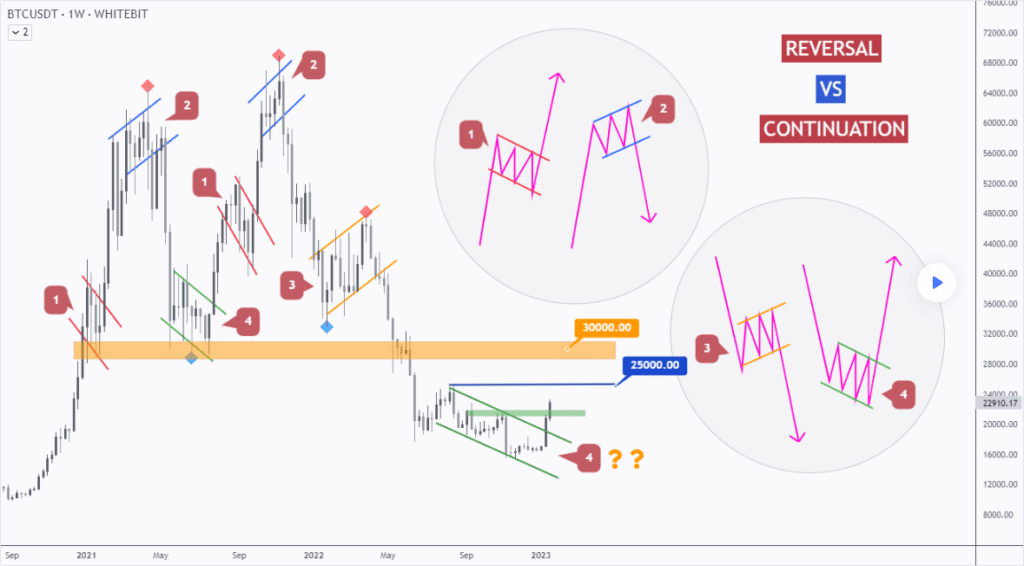
Another view shows we’re at a decisive point.
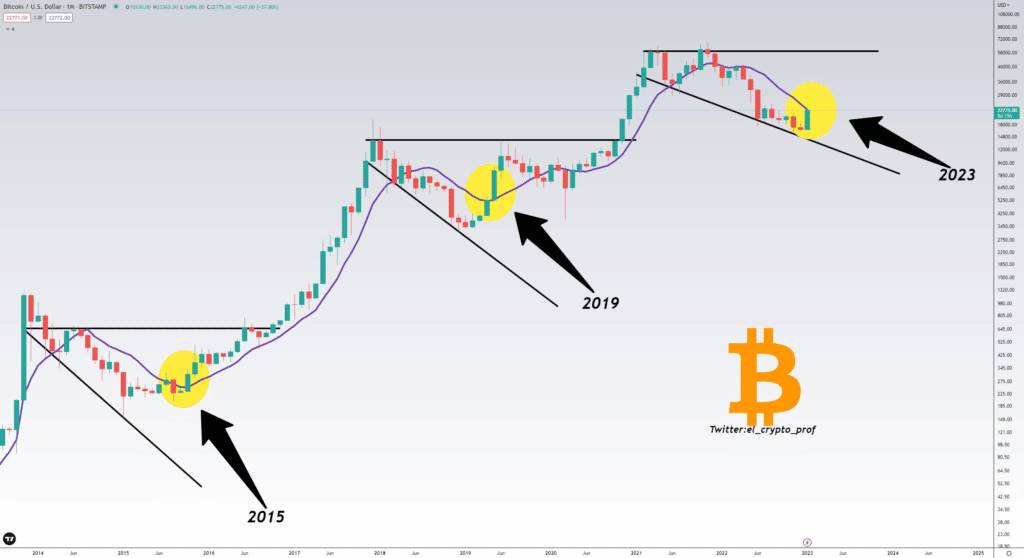
Here’s is another take on the Wyckoff Method, painting a similarly bullish picture.
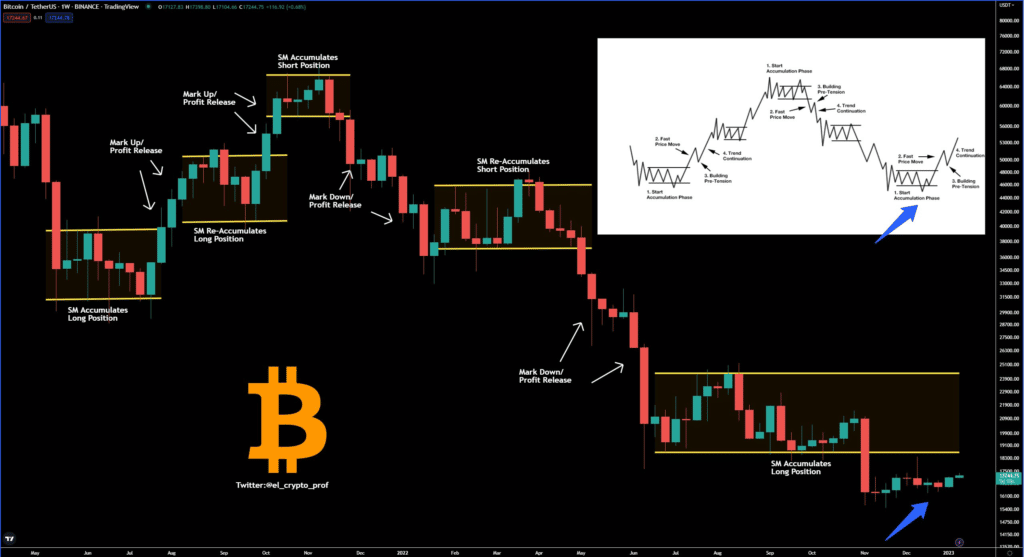
Overall, we see significant evidence the major downtrend is ending. Before calling it, we’d like to see January close above the 50-period daily SMA and break the monthly resistance line.
Current Crypto-ML Portfolio
Here’s the monthly view of our portfolio.
- During earlier periods of Extreme Greed, we slowly exited about 30% of our crypto positions to stablecoins.
- Over the last few months (June through July mainly) during Extreme Fear, we deployed out of stablecoins fully into crypto.
- We are actively dollar-cost-averaging into crypto every month.
- We have lump sums ready to deploy in case this is a bull trap and the market drops again.
- We are continuously working to ensure each position earns interest.
That last point is important. We are not relying on appreciation alone. Earning interest also means our investments are buying back in like-kind each month. Even if we don’t explicitly invest, these positions are growing and cost-averaging on their own.
Stablecoins: 0% (flat)
- This balance has been completely phased out during “Extreme Fear.” It originally consisted of profits that were booked during “Extreme Greed.”
BTC: 71% (+31%)
- Long-term hold
- Investing bi-weekly
BNB: 0% (-42%)
- Sold for large profit as long-term capital gain and redistributed to other positions
ETH: 24% (+9%)
- Earning interest through staking
- Long-term hold
Other: 5%
- This group consists of 17 altcoins.
As always, ensure your crypto portfolio is an appropriate percentage of your overall savings and investment plan. You need to determine your goals, risk tolerance, and ideal allocations.
Putting It All Together
Bitcoin is showing significant signs of recovery. But there are still concerns with the economy. Until those broader issues are sorted, limited money will be available to flow into Bitcoin.
Our recommendations from last month still apply:
- Move your crypto to your own non-custodial wallet at least while the industry dust settles.
- Minimize expenses.
- Don’t try to time the bottom or go all in.
- Determine a budget and diversified savings and investing plan. Bitcoin is a subset of this plan.
- Automate monthly Bitcoin investing so that you stick to your plan.
We are currently using Swan Bitcoin to automate regular purchases of Bitcoin and automate transferring it to our non-custodial wallets.

Learn more about Swan Bitcoin.
Questions and Comments
Do you have thoughts, comments, or criticisms of this analysis? Let us know in the comments below!
Subscribe to the Newsletter
Join 7k+ working professionals to "The Five-Year Plan". Every Saturday morning, you'll receive one actionable tip to create life-changing wealth in crypto.